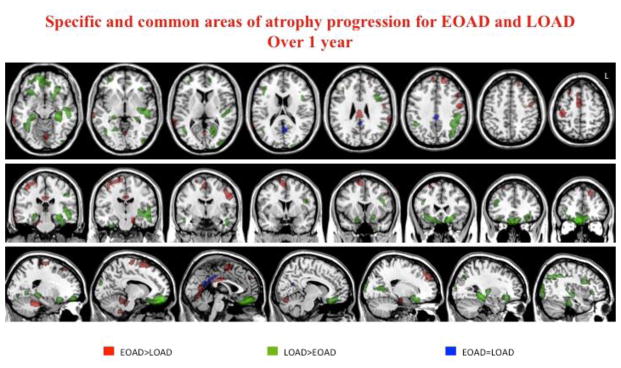
Figure 4.

Common and specific patterns of atrophy progression in EO and LOAD patients. Common area (blue) is centered on precuneus and posterior cingulum (conjunction analysis). More severe atrophy progression in EOAD (red) vs. LOAD were found in lateral and medial frontal areas, cingulate gyrus, lateral temporal regions as well as in peri-central regions, such the post-central gyrus, and the supplementary motor areas. LOAD patients (green) showed a greater atrophy progression in ventral frontal and temporal regions, included parahippocampal and fusiform gyri, as well as in lateral frontal and temporal, and occipital regions.
