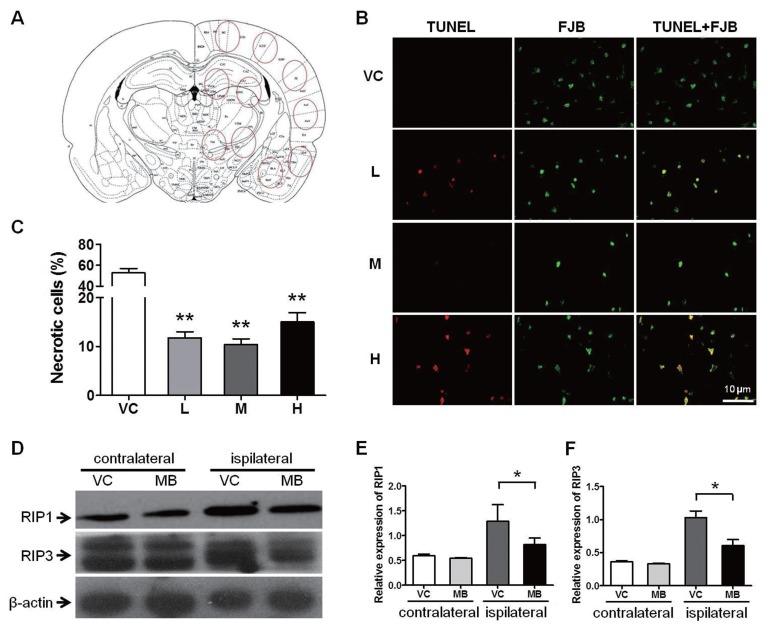
Figure 3.
MB alleviates necrosis. Necrosis was evaluated 24 h after stroke. (A) A schematic diagram of a coronal section of the brain. The red circles indicate the areas that we selected for imaging. (B) FJB and TUNEL double staining for the determination of necrosis. The FJB-labeled, TUNEL-negative cells are the necrotic cells. VC indicates vehicle control; and L, M and H, represent low, medium and high dose of MB, respectively. (C) Quantification of the percentage of necrotic cells. n = 25; **P < 0.01 compared with the VC. (D) Western blot analysis of the expression levels of the programmed necrosis molecules RIP1 and RIP3 from the brain tissue. β-actin was used as the internal control. The medium dose of MB was used in this assay. (E) and (F) The statistical analysis of the RIP1 and RIP3 expression levels. n = 5; *P < 0.05 compared with the VC in the ipsilateral hemisphere. Scale bar, 10 μm.

