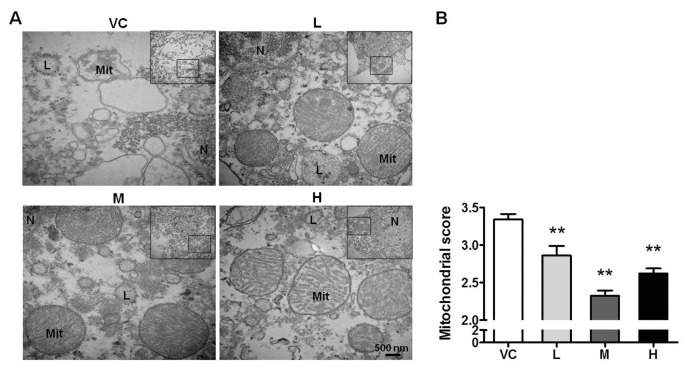
Figure 4.
MB prevents the disruption of the mitochondrial structure. (A) The ultrastructure of mitochondria based on TEM. The box indicates the source of the high magnification image. Mit, mitochondria; N, nucleus; L, lysosome. VC indicates vehicle control; and L, M and H, represent low, medium and high dose of MB, respectively. (B) Quantification of the mitochondrial scores based on the integrality of mitochondrial structure. n = 20; **P < 0.01 compared with the VC. Scale bar, 500 nm.

