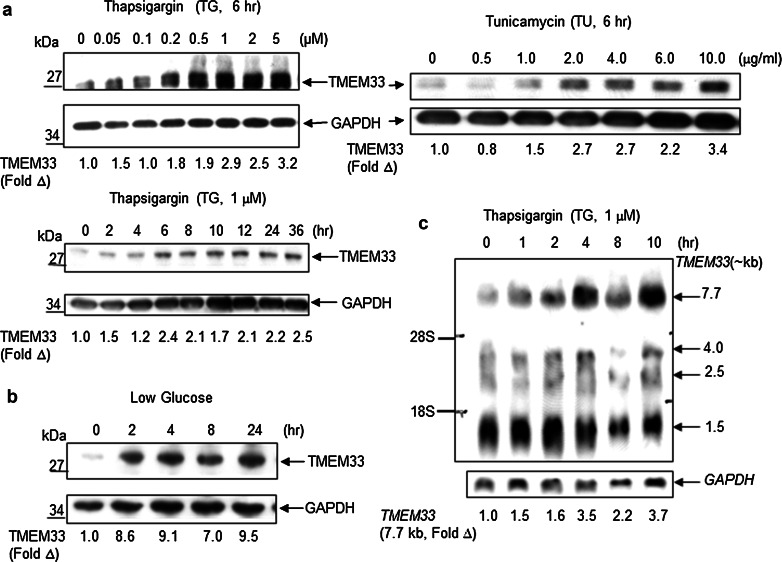
Fig. 4.
TMEM33 is an ER stress-inducible molecule. a HeLa cells were treated with indicated doses of thapsigargin (TG) or tunicamycin (TU) for various times, followed by immunoblotting with anti-TMEM33 antibody. The blots were reprobed with anti-GAPDH antibody. The expression levels of TMEM33 were quantified using ImageQuant software (Molecular Dynamics), and normalized against GAPDH in corresponding lanes. The fold open triangle indicates TMEM33 level at various doses or time points relative to control lane. Data shown are representative of two to three independent experiments. b HeLa cells were grown in high glucose (25 mM) DMEM containing 10 % FBS. The medium was switched to low glucose (5.5 mM) DMEM containing 10 % FBS for the times indicated, followed by sequential immunoblotting with anti-TMEM33 antibody and anti-GAPDH antibody. Normalized expression levels of TMEM33 were quantified as in panel a. Data shown are representative of two independent experiments. c Northern blot analysis of TMEM33 mRNA in HeLa cells treated with thapsigargin as shown. The blot was reprobed with radiolabeled GAPDH cDNA. The normalized expression levels of 7.7 kb TMEM33 transcript at various time points were quantified using ImageQuant software (Molecular Dynamics)

