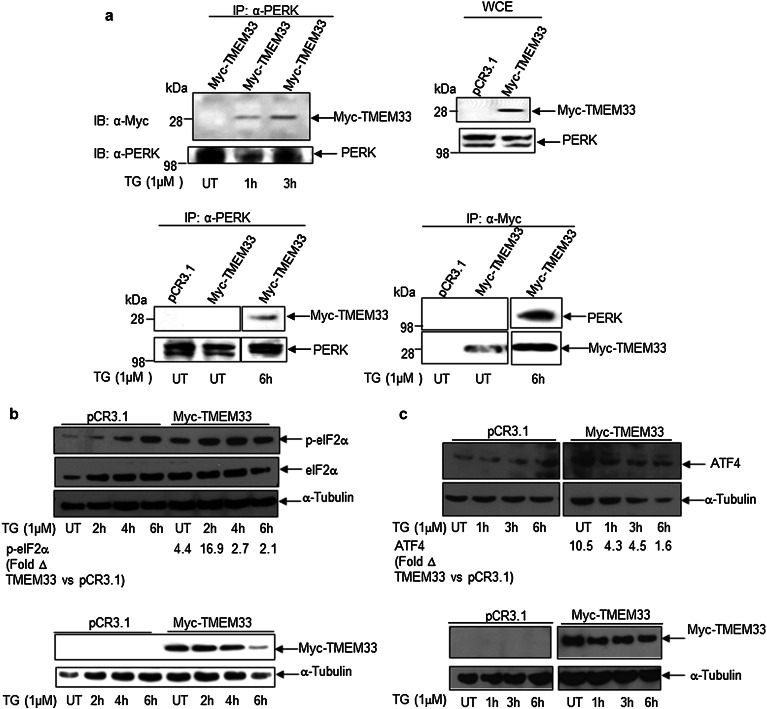
Fig. 5.
TMEM33 is a binding partner of PERK and TMEM33 overexpression correlates with increased levels of basal and ER stress- induced p-elF2α and ATF4 expression. a TMEM33 interacts with PERK in the presence of ER stress. HEK293T cells were transiently transfected with Myc-TMEM33 for 48 h at 37 °C, followed by treatment with 1 µM TG for the times indicated. The whole cell lysates were subjected to immunoprecipitation using anti-Myc antibody or anti-PERK antibody-conjugated Protein A/G and the immunoprecipitates were analyzed by Western blotting as indicated. Representative data from two independent experiments are shown. IP immunoprecipitation; IB immunoblotting; WCE whole cell extracts. UT untreated. b Increased basal and ER stress-induced expression of p-eIF2α in Myc-TMEM33 transfected HEK293T cells. HEK293T cells were transiently transfected with Myc-TMEM33 or pCR3.1 (empty vector) and incubated for 48 h at 37 °C, followed by treatment with 1 μM TG as indicated. Whole cell lysates were analyzed by Western blotting with anti-p-eIF2α antibody. Blots were reprobed with anti- eIF2α and anti-α-Tubulin antibodies (top panel). Cell lysates were also probed with anti-Myc and anti-α-Tubulin antibodies (bottom panel). For quantification of relative p-eIF2α levels in Myc-TMEM transfectants versus control vector at various time points, first total eIF2α levels were normalized against α-Tubulin in corresponding lanes. Expression levels of p-eIF2α were then normalized against α-Tubulin-normalized eIF2α levels in corresponding lanes. The fold Δ in p-eIF2α level was calculated by dividing normalized p-eIF2α level in Myc-TMEM transfectants by normalized p-eIF2α level in pCR3.1 transfectants in the corresponding treatment group. Representative data from three independent experiments are shown. UT, untreated. c Increased expression of ATF4 in Myc-TMEM33 transfected HEK293T cells. Whole cell extracts of empty vector (pCR3.1) or Myc-TMEM33 transfected cells were prepared after thapsigargin treatment (TG) as described in Materials and methods. Cell lysates were sequentially immunoblotted with anti-ATF4 and anti-α-Tubulin antibodies (top panel). Cell lysates were also probed with anti-Myc and anti-α-Tubulin antibodies (bottom panel). For quantification of relative ATF4 levels in Myc-TMEM33 transfectants versus control vector at various time points, expression levels of ATF4 were normalized against α-Tubulin in corresponding lanes. The fold Δ in ATF4 level was calculated by dividing normalized ATF4 level in Myc-TMEM33 transfectants by normalized ATF4 level in pCR3.1 transfectants in the corresponding treatment group. Representative data from two independent experiments are shown. UT untreated

