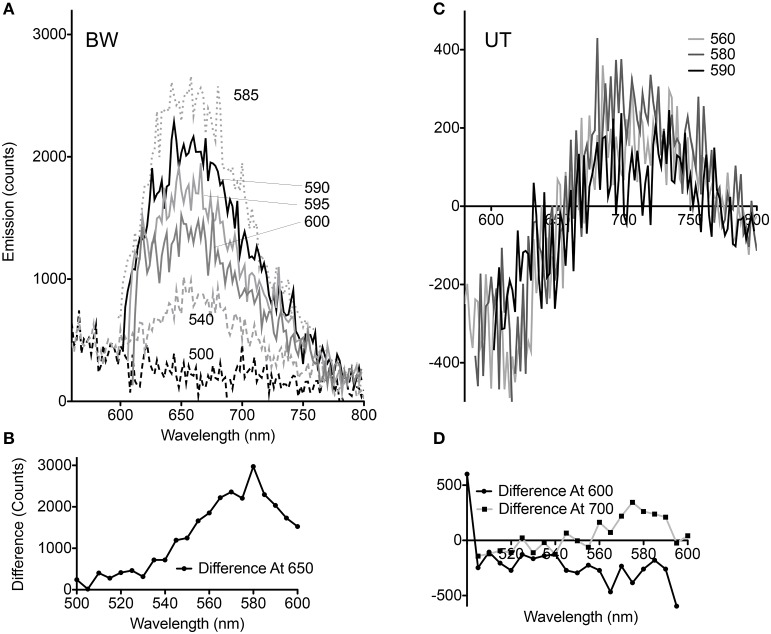
Figure 3.
Dependence of voltage-sensitivity upon wavelength of excitation. (A) Difference spectra (CCCP-no CCCP) for multiple excitation wavelengths in the BW strain. The different excitation wavelengths are indicated by numbers next to the curves. (B) Difference at 650 nm emission vs. excitation wavelength in the BW strain. (C) Difference spectra (CCCP-no CCCP) for multiple excitation wavelengths in the UT strain. (D) Difference at 600 and 700 nm emission vs. excitation wavelength in the UT strain.

