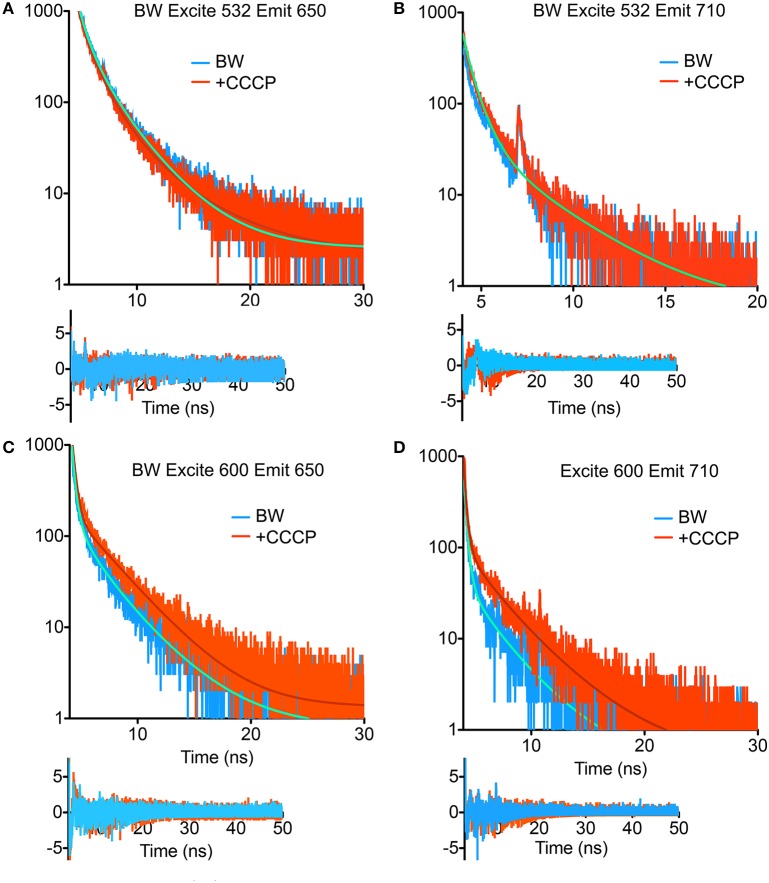
Figure 4.
Fluorescence lifetime decays of the PROPS-expressing BW strain. Fits are to the parameters shown in Tables 1, 2 with residuals shown beneath the curves. (A) Excitation at 532 nm, emission at 650 nm. (B) Excitation at 532 nm, emission at 710 nm. The fits for the two curves overlap. (C) Excitation at 600 nm, emission at 650 nm. (D) Excitation at 600 nm, emission at 710 nm.

