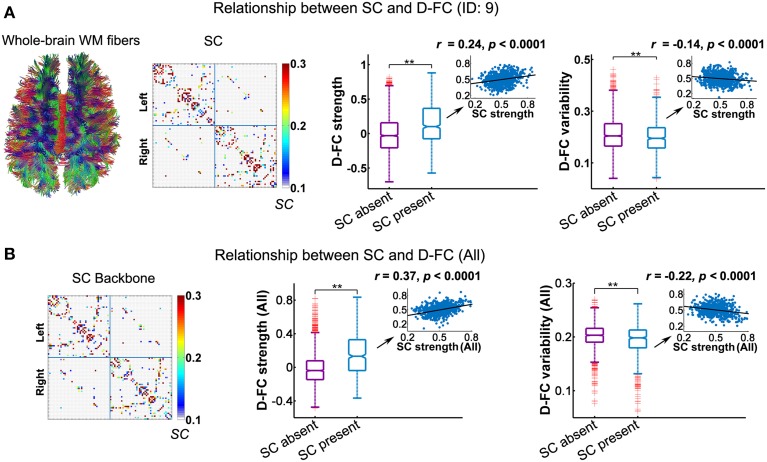
Figure 4.
Relationship between the D-FC and structural connectivity (SC) networks for one representative participant (ID: 9) (A) and for the whole group (B). (A) Schematic of whole-brain white matter (WM) fibers and SC matrix (left), and the differences in D-FC strength and variability between region pairs with direct SC (SC present) or not (SC absent) (right). The WM fibers were estimated from whole-brain tractography, and SC strength was represented by the normalized streamline number. (B) The SC backbone network across all participants (left) and differences in D-FC strength and variability between region pairs with or without direct SC (right). Group-level analyses were performed on the 10 participants that possessed both R-fMRI and DTI data, given that the DTI data of one participant (ID: 1) were not available. In (A,B), significant differences in D-FC strength/variability between two groups were tested using permutation tests (**p < 0.0001, 10,000 permutations). Scatter plots (insets) show the correlation between D-FC strength/variability and SC strength, confined to the regional pairs with direct SC. Prior to the correlation analysis, all of these measures were resampled into a Gaussian distribution, with mean ± std = 0.5 ± 0.1. D-FC, dynamic functional connectivity.

