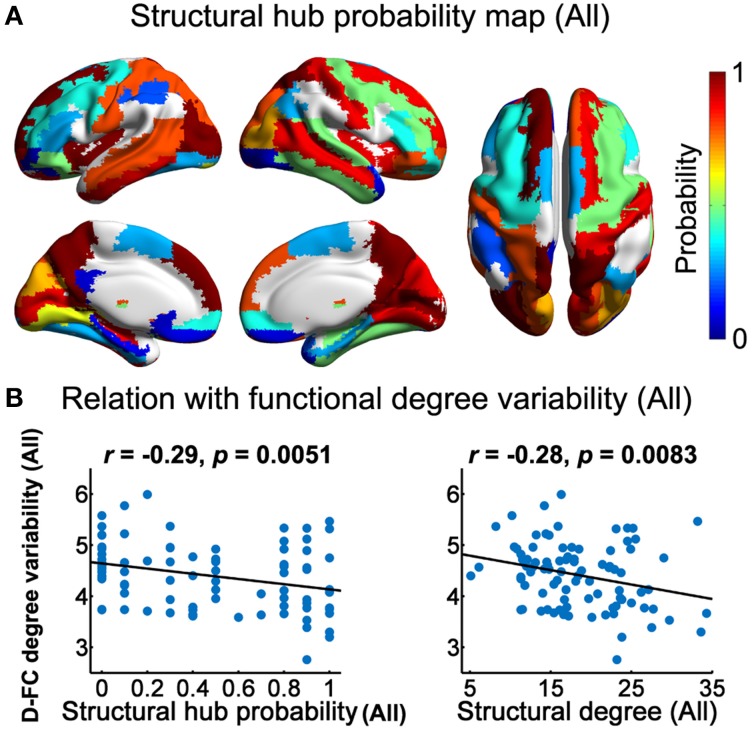
Figure 5.
Structural brain hubs and their associations with D-FC networks. (A) Structural hub probability map for all participants, which was generated by counting the occurrence probability as structural hubs across participants for each region. (B) Scatter plots showing the across-node relationship between temporal variability of functional degree centrality in the D-FC networks and structural hub probability (left) and structural degree centrality (right). Given the discrete values of structural hub probability, Spearman's correlation analysis was used. D-FC, dynamic functional connectivity.

