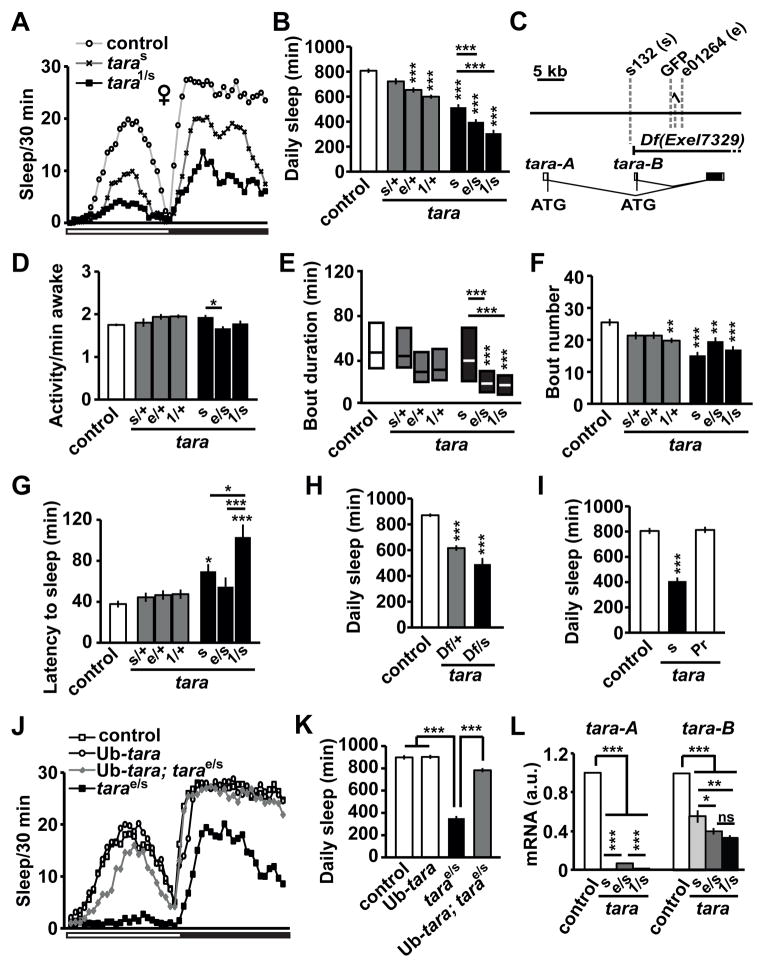
Figure 1. Sleep Phenotypes of tara Mutants.
(A) Sleep profile of background control (white circles), taras132 (taras, black X’s), and tara1/s132 (tara1/s, black squares) female flies (n=50–64) in 30 min bins. The white and black bars below the X-axis represent 12 h light and 12 h dark periods, respectively. (B) Total daily sleep amount for control and tara female flies of the indicated genotypes (n=44–72). In this and subsequent figures, s132 and e01264 alleles are referred to as s and e, respectively. (C) Schematic of the genomic region of the tara locus. Gray dashed lines indicate transposon insertion sites. The Exel7329 deficiency removes most of tara-A and all of tara-B coding regions as indicated. (D) Waking activity (activity counts per waking minute), (E) sleep bout duration, (F) sleep bout number, and (G) sleep latency (time from lights off to the first sleep bout) for the same female flies shown in (B). Sleep bout duration is not normally distributed, and is shown in simplified box plots, where the median and interquartile range are represented. (H) Total daily sleep amount of control and Df(3R)Exel7329 female heterozygotes in trans to either a wild type (Df/+) or taras132 (Df/s) allele (n=35–102). (I) Total daily sleep of control, taras132, and precise excision (taraPr) female flies (n=16–36). (J) Sleep profile of female flies of the indicated genotypes (n=53–58). The white and black bars below the X-axis represent 12 h light and 12 h periods, respectively. (K) Total daily sleep amount for the same flies showed in (J). (L) tara-A and tara-B mRNA levels relative to actin mRNA levels in head extracts of indicated genotypes (n=3–6). For each experiment, relative tara mRNA levels of the control flies were set to 1. Mean ± SEM is shown. *p < 0.05, **p < 0.01, ***p < 0.001, ns: not significant, one-way ANOVA followed by Tukey post hoc test (B, D, F, G, K, L) or Dunnett post hoc test relative to control flies (H, I); Kruskal-Wallis test (E). For simplicity, only significant differences between the control and each mutant genotype (above the bar for the mutant) and those between taras132, tarae01264/s132, and tara1/s132mutants (above the line for the mutant pair) are indicated. See also Figure S1.

