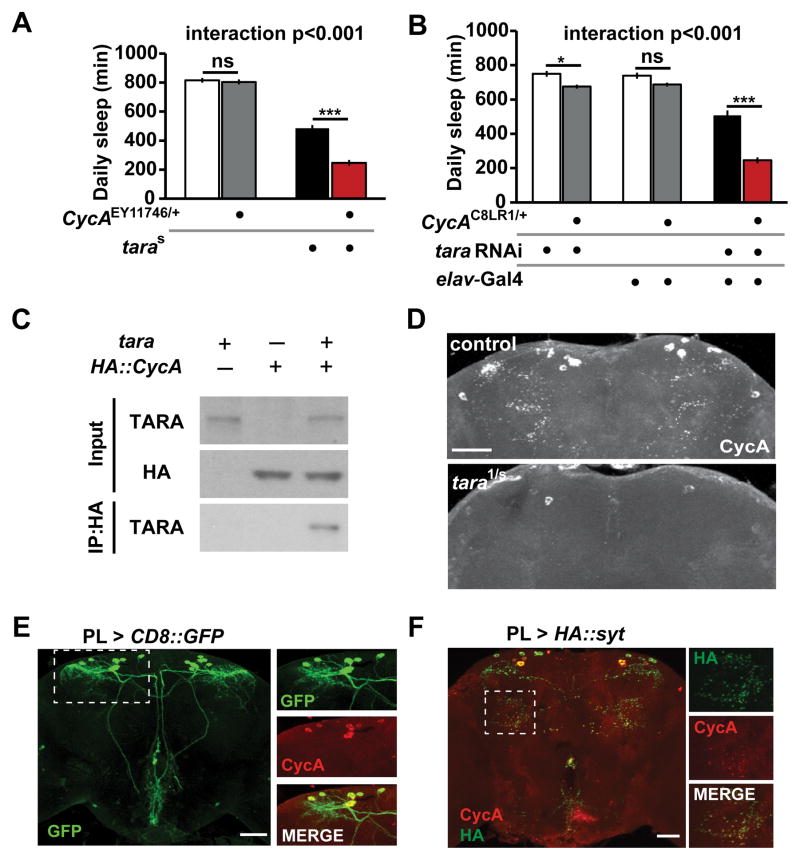
Figure 4. tara Interacts with CycA and Regulates CycA Levels.
(A) Daily sleep for female flies of indicate genotypes demonstrating a synergistic interaction between cycAEY11746/+ and taras132 (n=43–60). (B) Daily sleep for female flies of the indicated genotypes. Pan-neuronal knockdown of tara by RNAi (elav > tara RNAi) was more effective at suppressing sleep in a CycAC8LR1/+ background than in a control background (n=46–52). (C) TARA and CycA form a complex in S2 cells. HA-tagged CycA was immunoprecipitated with an anti-HA antibody, and anti-TARA and anti-HA antibodies were used for Western blotting. The experiment was repeated 3 times with similar results. (D) Maximal-intensity confocal projections of the dorsal half of the central brain of representative control and tara1/s132 adult females immunostained with an antibody to CycA. Scale bar: 50 μm. (E) The central brain of an adult fly in which PL-Gal4 was used to express membrane-targeted CD8::GFP. Scale bar: 50 μm. Images on the right show colocalization of CycA and GFP driven by PL-Gal4 in the brain region indicated by the rectangle. (F) The central brain of a fly in which the synaptic marker HA::SYT was expressed using PL-Gal4. The brain was costained with anti-HA and anti-CycA. The rectangle indicates the region magnified in the images on the right. Scale bar: 50 μm. Mean ± SEM is shown. *p < 0.05; ***p < 0.001, ns: not significant, Tukey post hoc test. See also Figure S4.

