
FIGURE 3.
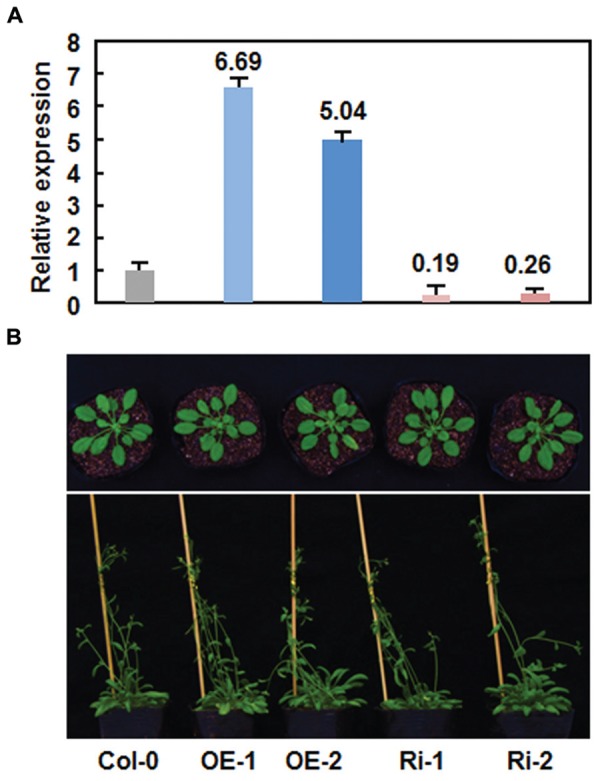
No defects in growth and reproduction of the AtERF15-overexpressing (OE) and AtERF15-RNAi (Ri) plants. (A) Expression levels of AtERF15 in AtERF15-OE and AtERF15-Ri lines analyzed by qRT-PCR. (B) Morphological comparison of the AtERF15-OE and AtERF15-Ri plants with the Col-0 plants. Top panel, 4-week-old plants; bottom panel, 6-week-old plants.