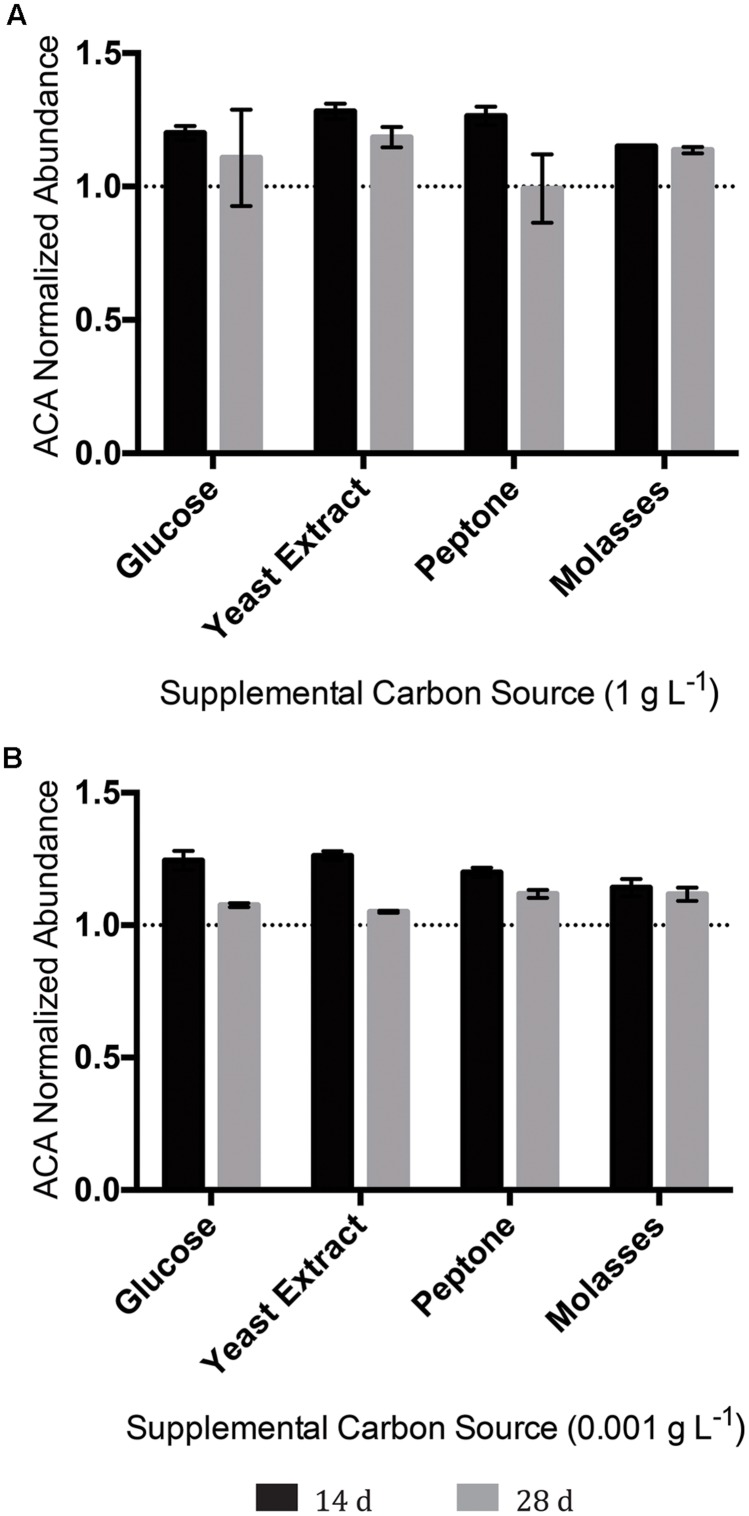
FIGURE 7.
Abundance of the tricyclic, diamondoid ACA following incubation with OSPW multispecies biofilms grown in BH minimal medium and 100 mg L-1 ACA with either 1 g L-1 supplemental carbon (A), or 0.001 g L-1 supplemental carbon (B). GC-FID was used to determine normalized abundance values relative to an internal standard at 14, and 28 days time points (n = 2). Error bars represent standard error of the mean. A normalized abundance value of ‘1.0’ represents starting ACA levels.

