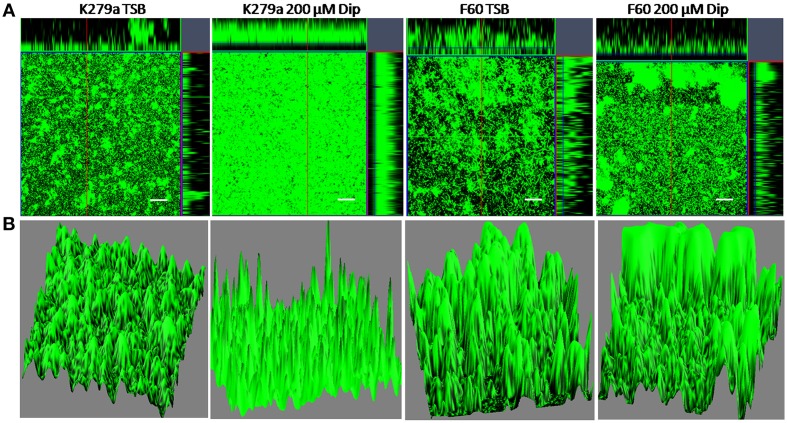
Figure 2.
CLSM analysis of biofilms from S. maltophilia K279a and its Fur mutant. Biofilms were grown in glass LabTek chambers, in TSB and TSB supplemented with 200 μM Dip for 48 h. Then, biofilms were stained with Syto9 and analyzed by CSLM, using a 40X water immersion objective lens. (A) Central panels represent the x–y plane, and the top and right side panels represent the x–z and y–z planes, respectively. Scale bars represent 20 μm. (B) Three-dimensional projections of biofilm structure were reconstructed using the Image J program. The images are representative of those obtained on three independent occasions.

