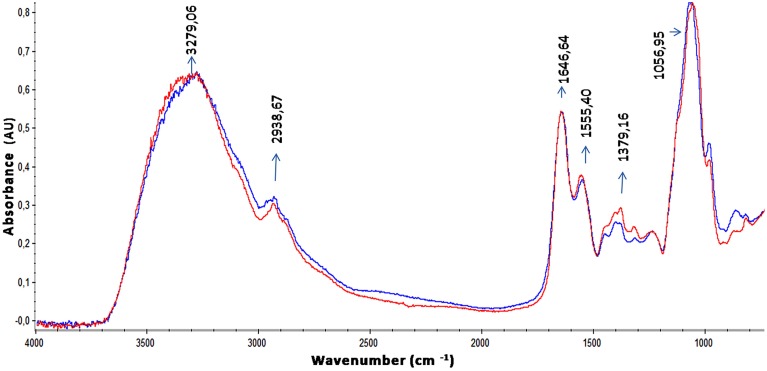
Figure 3.
ATR-FTIR spectra of EPS from S. maltophilia strains. Spectra of ethanol precipitated EPS from K279a and F60 are shown in blue and in red, respectively. Bands associated with lipids (3100–2800 cm−1), proteins (1700–1500 cm−1) mainly identified by the amide I (1646,64 cm−1) and amide II bands (1555,40 cm−1), and polysaccharides and nucleic acids (1300–900 cm−1) are indicated in the spectra.

