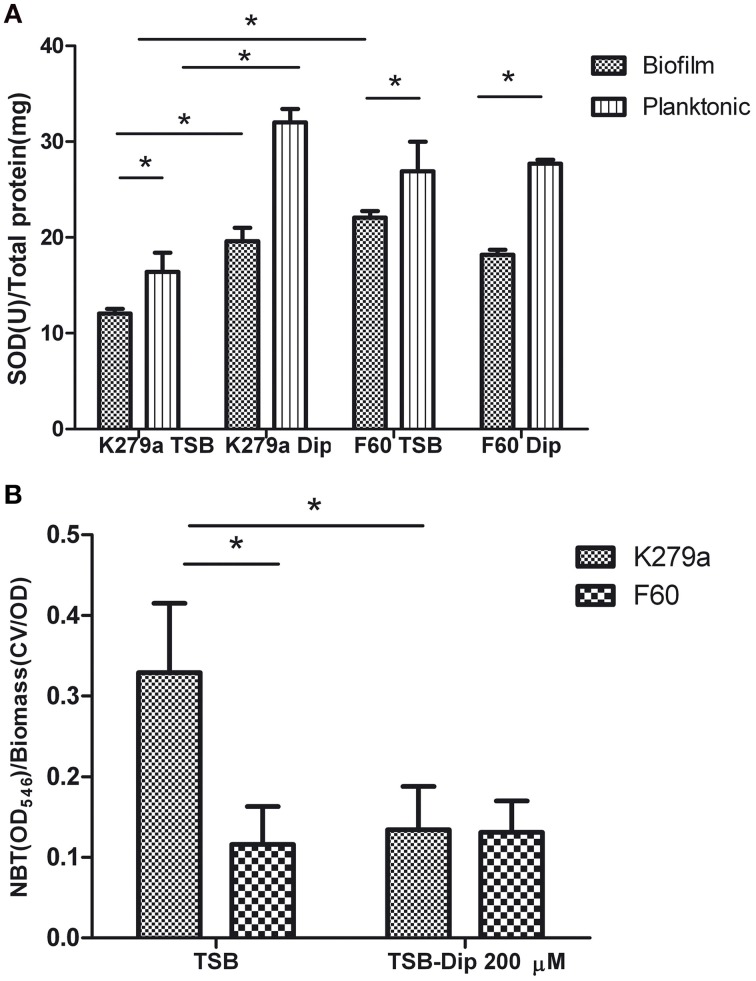
Figure 5.
SOD activity and ROS levels in S. maltophilia K279a and F60. Bacterial cultures were performed in TSB and TSB supplemented with 200 μM Dip for 48 h (A) SOD activity of crude extracts from plaktonic and biofilms cells determined by the riboflavin/methionine system, as described in the text. Activity was expressed as units of SOD per mg of protein. (B) Levels of ROS in biofilms of S. maltophilia. The biofilms formed in microtiter plates were treated with NBT. Reduced NBT was measured as formazan blue at 540 nm and expressed relative to the biomass of biofilm. Results represent the mean ± standard deviation of one representative experiment. Asterisks indicate significant difference (*p < 0.01).

