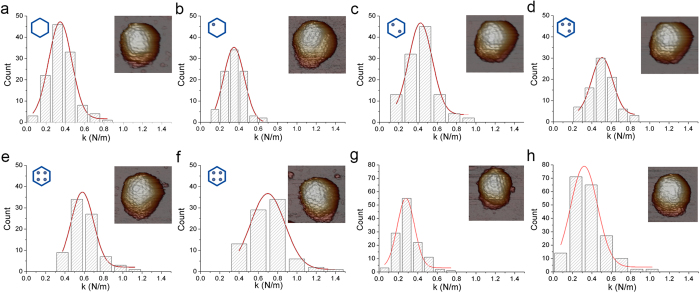
Figure 1. Mechanical rigidity of IBDV E1-E6 populations and IBDV T = 13 VLP.
(a–f) Histogram of slopes of the indentation curves carried out for (a) E1, (b) E2, (c) E3, (d) E4, (e) E5 and (f) E6 IBDV capsids. They show the rigidity values (spring constant, k) for individual particles after nanoindentation. The k value for each population was calculated by Gaussian fits, (a) kE1 = 0.346 ± 0.118 N/m; (b) kE2 = 0.347 ± 0.106 N/m; (c) KE3 = 0.426 ± 0.121 N/m; (d) kE4 = 0.505 ± 0.109 N/m; (e) kE5 = 0.580 ± 0.116 N/m; and (f) kE6 = 0.697 ± 0.177 N/m. AFM images (160 × 160 nm2) of individual IBDV particles are shown (top, right inset). Hexagon diagrams show the amount of RNP (indicated as dots) packed inside the particle for each type of IBDV population (top, left inset). Each dot in the diagrams corresponds to a VP3-dsRNA monomer (with an A or B segment). (g,h) Histogram of the slopes of the indentation curves for (g) empty and (h) full IBDV T = 13 VLP. The k value for each population was calculated by Gaussian fits; for (g) kEmty VLP = 0.277 ± 0.088 N/m and (h) kFull VLP = 00.320 ± 0.134 N/m. AFM images (160 × 160 nm2) of individual IBDV (a–f) and T = 13 VLP (g,h) are shown (top, right inset).

