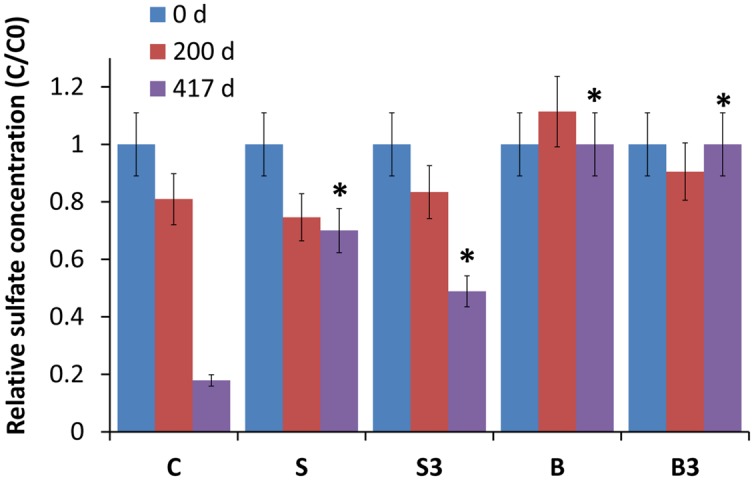
FIGURE 3.

Relative sulfate concentration in the different treatments, measured after 0, 200, and 417 days of incubation. Error bars represent the SE of replicate samples. Statistically significant differences (with respect to the corresponding values of treatment “C”) are noted at the ∗p = 0.05 thresholds from two-tailed t-test.
