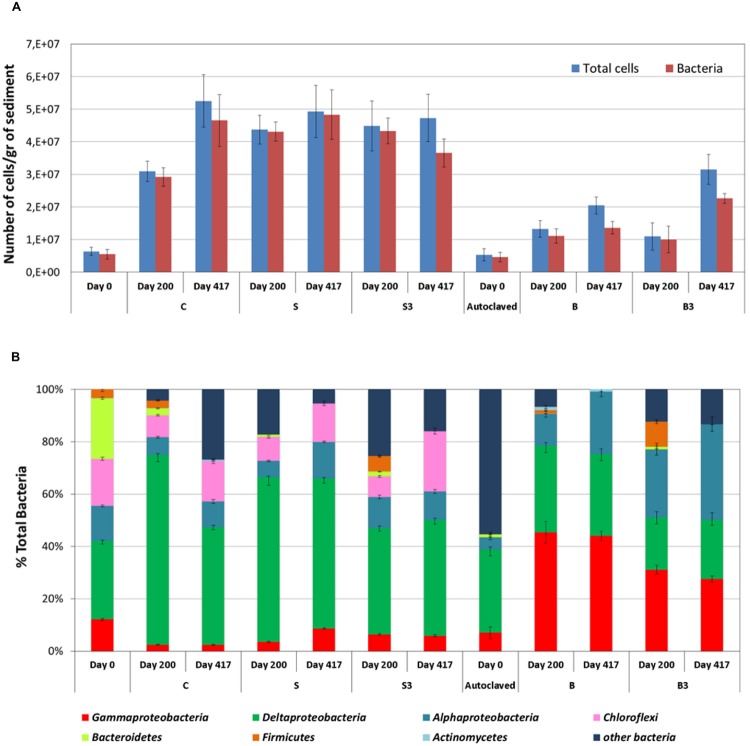
FIGURE 5.
(A) Amount of total cells and Bacteria in the sediment from the different treatments as measured after 0, 200, and 417 days of incubation. (B) Analysis of the bacterial component of the microbial community of the sediment using group-specific Catalyzed Reporter Deposition-Fluorescence In Situ Hybridization (CARD-FISH) probes (samples taken at the end of the incubation). Error bars represent the SE of replicate samples.

