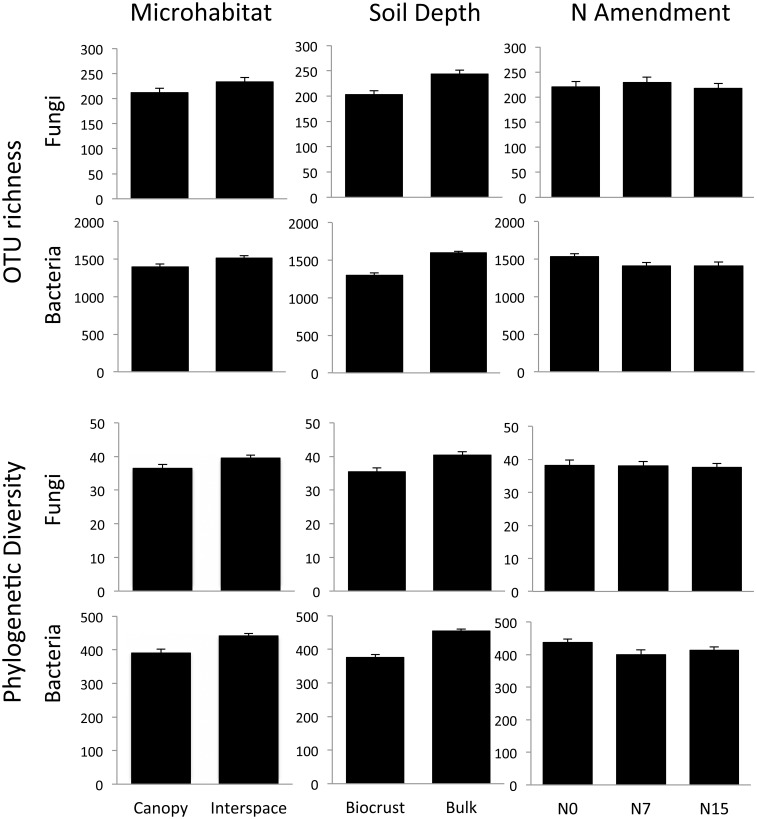
Figure 3.
OTU richness and phylogenetic diversity (Faith's PD) in the N-amended plots across different soil depths and microhabitats. Both communities showed significant differences across soil depths and microhabitats, but only bacteria showed significant shifts in response to N. While results are illustrated here by individual treatment, the results were analyzed using a Three-Way ANOVA framework. See Results text for statistical support.

