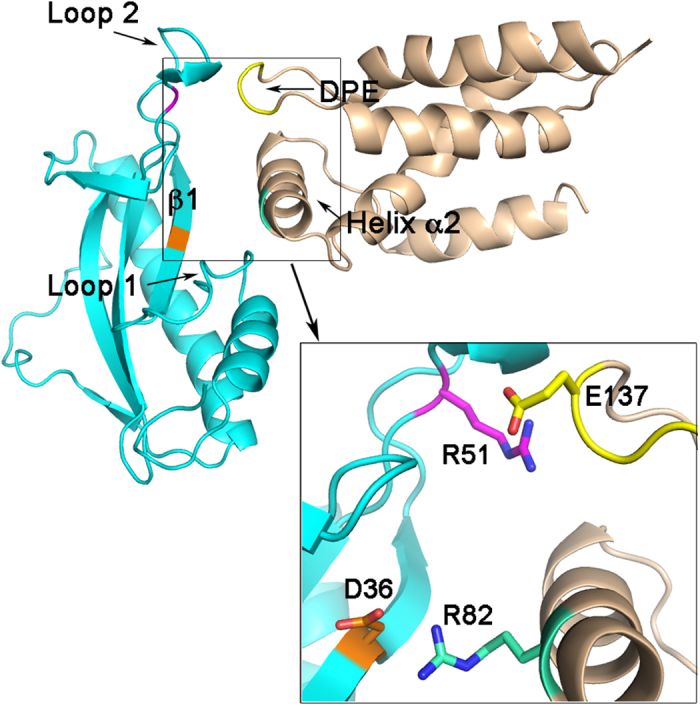
Figure 8. Cartoon representation of the proposed σS-Crl interface.

The most likely model (Model E, Supplementary Fig. S11) is shown with Crl depicted in cyan and σS in wheat. The region containing the two salt bridges between σS and Crl is zoomed. In the zoom view, the side chain of the charged residues, involved in salt bridges, are colored as follows: in Crl, R51 in orange, D36 in magenta and in σS, R82 in green and the DPE motif in yellow.
