Figure 5.
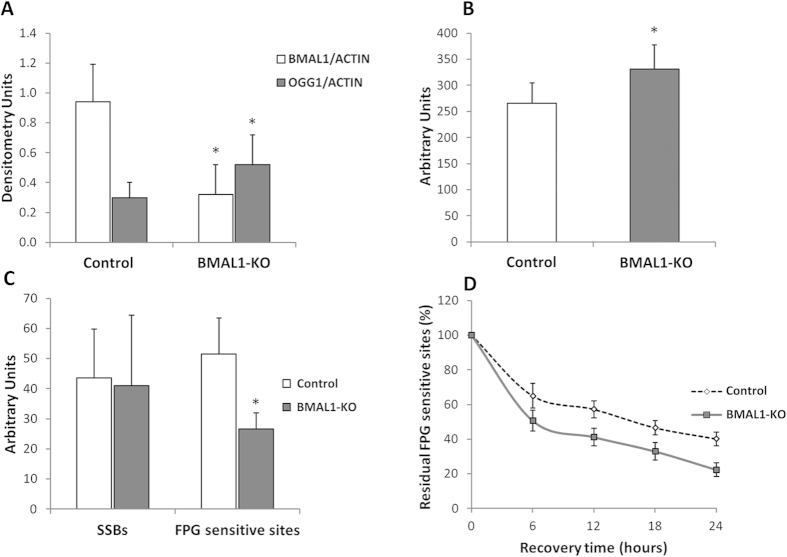
(A) Mean (±SD) densitometry of BMAL1 and OGG1 protein in control HuDe (cell line transfected using a shRNA with a scrambled sequence) and BMAL1-KO HuDe (cell line transfected with shRNA specifically targeting BMAL1) * = p < 0.05 BMAL1-KO vs control HuDe. (B) Mean (±SD) level of OGG1 activity in control and BMAL1-KO HuDe. * = p < 0.05 BMAL1-KO vs control HuDe. (C) Mean (±SD) level of SSBs and FPG sensitive sites in control and BMAL1-KO fibroblasts. * = p < 0.05 BMAL1-KO vs control HuDe. (D) The kinetics of repair of FPG sensitive sites at 0, 6, 12, 18 and 24 hours after ex vivo oxidative treatment (Ro 198022). The kinetics of DNA repair was calculated as a percentage of residue damage with respect to the damage at 0 minutes. * = p < 0.05 BMAL1-KO vs control HuDe.

