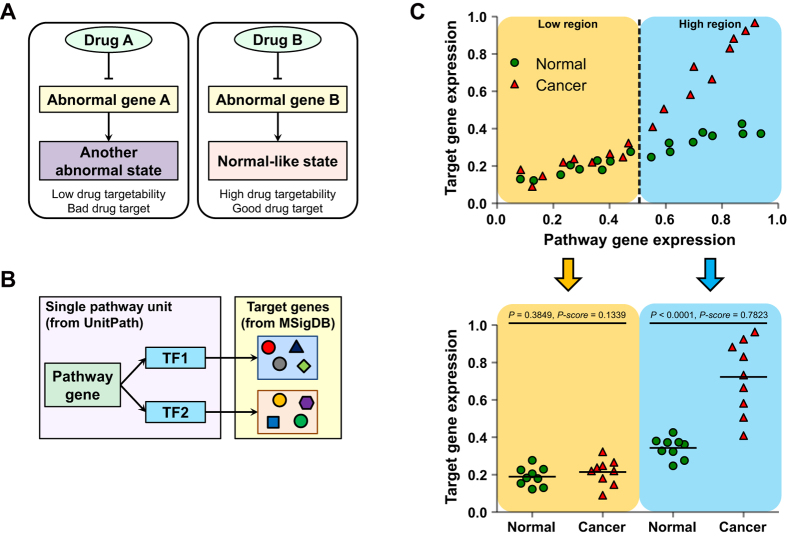
Figure 1. Overview of the study approach.
(A) Several abnormal genes (gene A and B) can induce disease conditions. When abnormal gene A is inhibited by drug A, a phenotype of patient is converted to another abnormal state (left, indicating low drug targetability and bad drug target). In contrast, inhibition of abnormal gene B with drug B lead to normal-like state (right, indicating high drug targetability and good drug target). (B) For a gene involved in a pathway unit (pathway gene), target genes of TFs involved in the same pathway unit were considered to be target genes of the pathway genes. UnitPath database was used for pathway information, and MSigDB was used to retrieve target gene information of TFs. (C) Schematic diagram of the evaluation of P-score in the low region (LP) and that in the high region (HP). According to the level of pathway gene expression (x-axis), we divided the low region (≤0.5) and high region (>0.5), and then compared expression levels of the target genes (y-axis) for each region.

