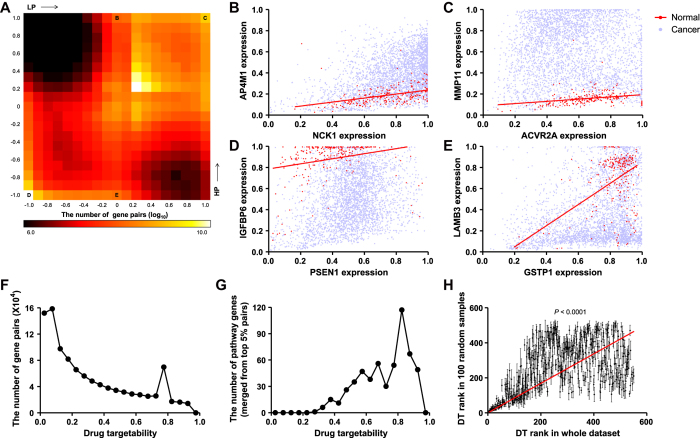
Figure 3. Evaluation of drug targetability in breast cancer.
(A) Two-dimensional heat map histogram for the number of pathway gene-target gene pairs (log10) in terms of LP and HP. (B–E) Scatter plots of the expression of pathway genes (NCK1, ACVR2A, PSEN1, and GSTP1, respectively) and their target genes (AP4M1, MMP11, IGFBP6, and LAMB3, respectively). (B) represents the case of high HP, (C) represents the case of both high LP and HP, (D) represents the case of both low LP and HP, and (E) represents the case of low HP, as indicated in (A). (F) Frequency distribution of the value of drug targetability for all pathway gene-target gene pairs. (G) Frequency distribution of the merged drug targetability value for each pathway gene. The values were merged from pathway gene-target gene pairs with top 5% of drug targetability. (H) X-axis indicates the ranks of drug targetability from the whole dataset and y-axis indicates those from 100 random samples. The slope of linear regression (red line) was significantly non-zero (t = 44.78). Pearson correlation of two ranks was statistically significant (P < 0.0001, R2 = 0.3084).

