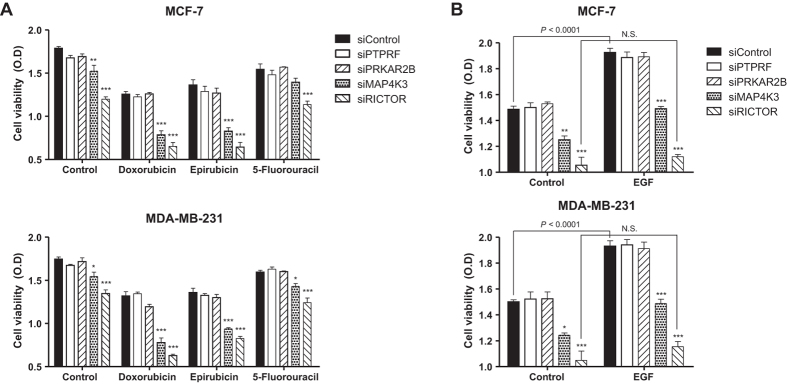
Figure 4. Evaluation of cell viability with knockdown of target genes.

Knockdown of PTPRF, PRKAR2B, MAP4K3, and RICTOR was enabled by siRNA transfection as described in the Materials and Methods. (A) At 48 h post-transfection, cells were treated with doxorubicin (5 mg/L), epirubicin (5 mg/L), and 5-fluorouracil (50 μM) for 24 h, and then cell viability was measured by WST-1 assay. (B) At 48 h post-transfection, cells were incubated with EGF or serum-free media for 24 h, and then cell viability was measured by WST-1 assay. Data are presented as means ± SEM, n = 4. Each group (such as Control, Doxorubicin, and EGF) was compared by one-way ANOVA with Tukey’s post hoc test for multiple comparisons. For all groups, P < 0.0001 in ANOVA, and asterisks indicate significant differences by Tukey’s post hoc test (*P < 0.05, **P < 0.01, ***P < 0.001) compared with the siControl. Levels of significance for comparisons between the control and EGF groups in (B) were determined using Student’s t-test (N.S. indicates not significant).
