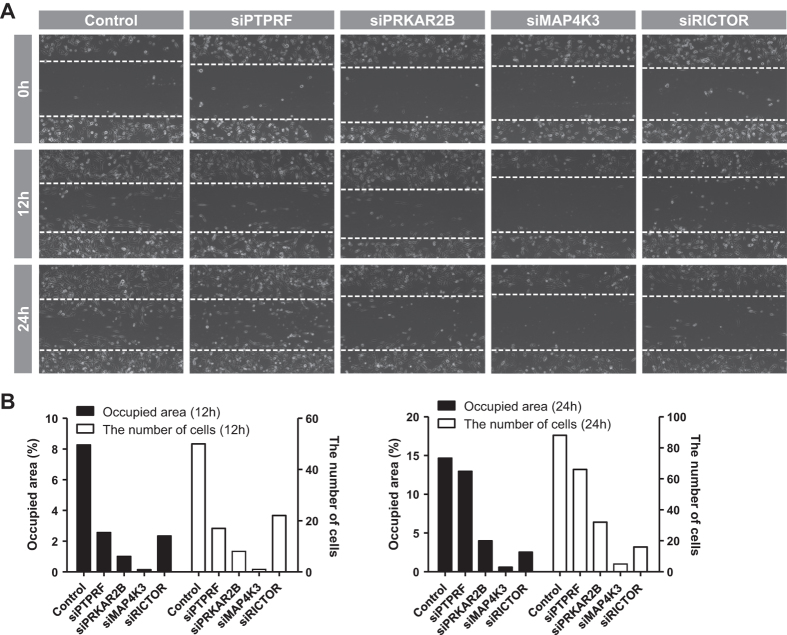
Figure 5. Evaluation of cell migration with knockdown of target genes.
Knockdown of PTPRF, PRKAR2B, MAP4K3, and RICTOR was enabled by siRNA transfection, and cell migration was measured by wound-healing assay as described in the Materials and Methods. (A) At 48 h post-transfection, MDA-MB-231 cells were subjected to a wound-healing assay. Inside the horizontal axis (white dashed line) represents the wounded region. Images were captured at 0, 12, and 24 h using phase contrast microscopy. (B) Cell migration was quantified in terms of two features using CellProfiler. Black bar indicates the ratio of the occupied area with migrated cells to the total wounded area. White bar indicates the total number of migrated cells in the wounded region.

