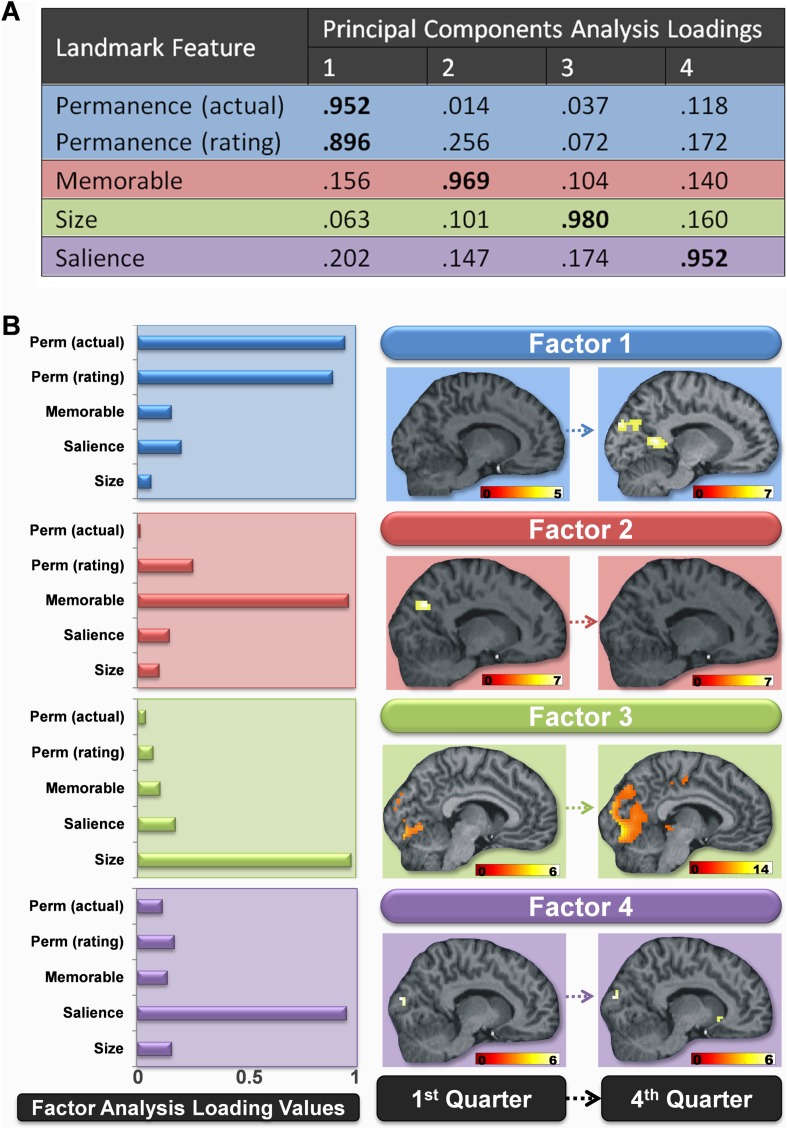
Figure 3. Changes in the brain regions engaged by different landmark features over the course of learning.
(A) The loading values of each landmark feature to the four principal component factors. Values above 0.5 are highlighted in bold. Factor 1 was strongly related to landmark permanence, factor 2 to their memorableness, factor 3 to their size and factor 4 to the visual salience of landmarks. (B) The bar graphs to the left show how strongly each of the four factors was related to the various features rated by subjects in the post-scan debrief. The associated brain regions responding to these four factors in the first and last quarters of learning are shown to the right. All activations are shown on a structural MRI brain scan of single representative subject. Each factor's activations are shown on the same sagittal slice and using a whole brain uncorrected threshold of p < 0.00001 for display purposes. The colour bars indicate the Z-score associated with each voxel.

