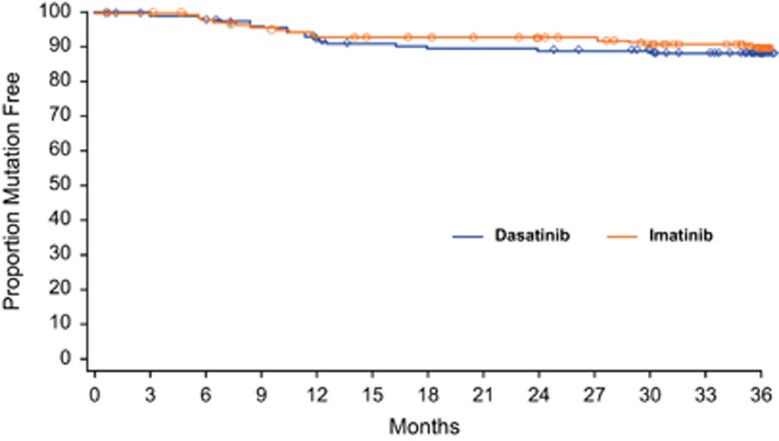
Figure 2.
Detection of mutations over time. Kaplan–Meier curve of the detection of mutations for both dasatinib- and imatinib-treated patients tested for mutations. Dasatinib-treated patients with samples analyzed for mutations: n=155; imatinib-treated patients with samples analyzed for mutations: n=183. Patients were censored when they were no longer at risk for developing a mutation.

