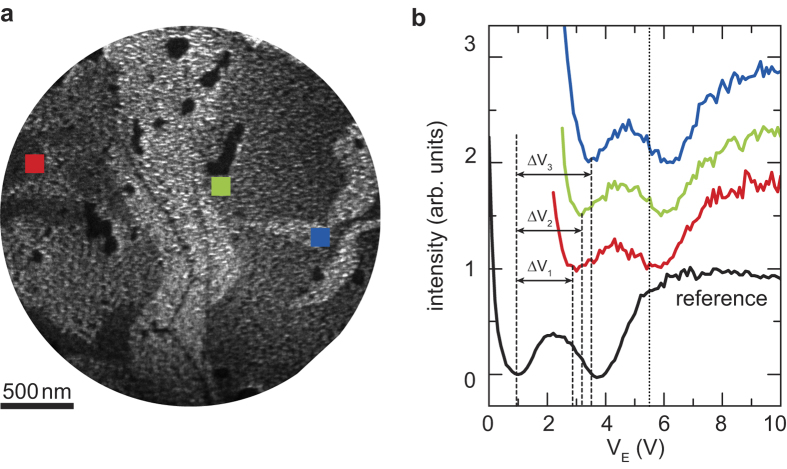
Figure 3. The local IV-curves are shifted in energy due to local potential differences.
(a) LEEM image taken at VE = 5.4 V with a sample bias of Vbias = −3 V. Due to the bias the landing energy becomes position dependent (see Fig. 1c). Hence, bilayer areas on the left (ground side) appear dark, while they are bright at the right (bias side). (b) IV-curves taken at bilayer areas from single pixels in the areas indicated by squares in (a). They show the two characteristic minima but are shifted with respect to the reference curve obtained from the unbiased case in Fig. 2c. The shifts ΔV are a direct measure for the local potential. The curves are offset in intensity for clarity. The dotted line indicates the electron energy in (a).

