
Fig. 2. Region of interest (ROI) placement from mapping images.
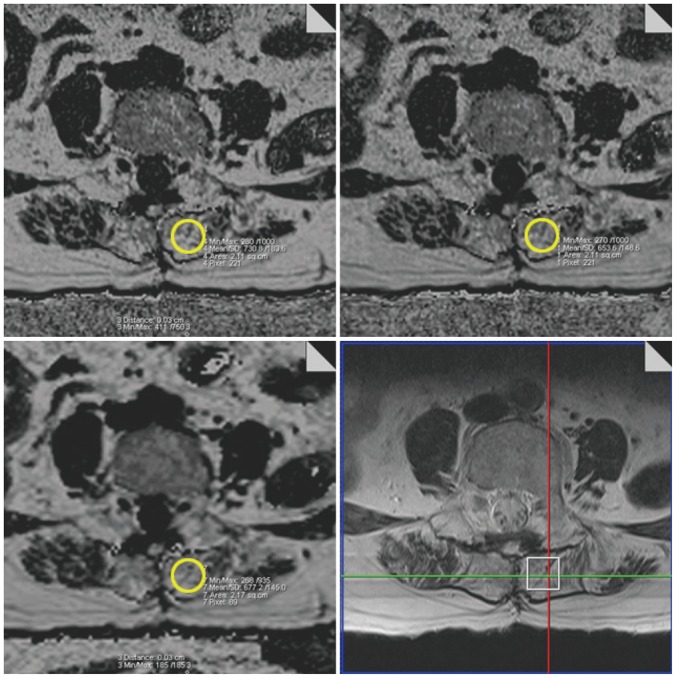
Example of screen-captured image of ROI placement from mapping images, obtained from 68-year-old male subject. ROI was drawn on mapping image from non-T2*-corrected two-echo volume interpolated breath-hold gradient-echo Dixon (VIBE-Dixon) sequence (top left) at same location of spectroscopic voxel referring to captured image (bottom right) obtained while placing voxel in each MR imaging. This was then copied and pasted to other mapping images from T2*-corrected three-echo VIBE-Dixon sequence (top right) and T2*-corrected six-echo VIBE-Dixon sequence (bottom right). Diameter of circular ROI was fixed at 15 mm, based on voxel size of MR spectroscopy. For precise representative data acquisition embracing entire voxel area, ROIs were drawn at three consecutive slices of mapping images in same manner as stated above. As result, three ROI measurements from three fat-signal fraction pulse sequences were obtained for every voxel location.