
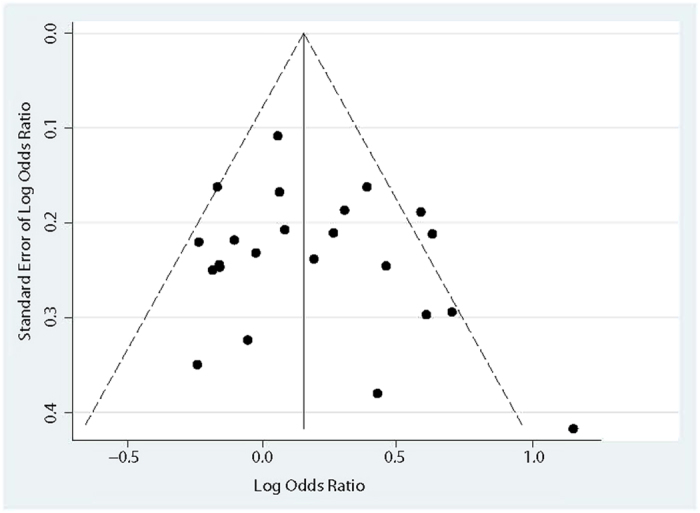
Figure 3. Funnel plot of association between NOS3 G894T polymorphism (G/G+T/T vs. G/T) and the risk of AD risk.
Official websites use .gov
A
.gov website belongs to an official
government organization in the United States.
Secure .gov websites use HTTPS
A lock (
) or https:// means you've safely
connected to the .gov website. Share sensitive
information only on official, secure websites.