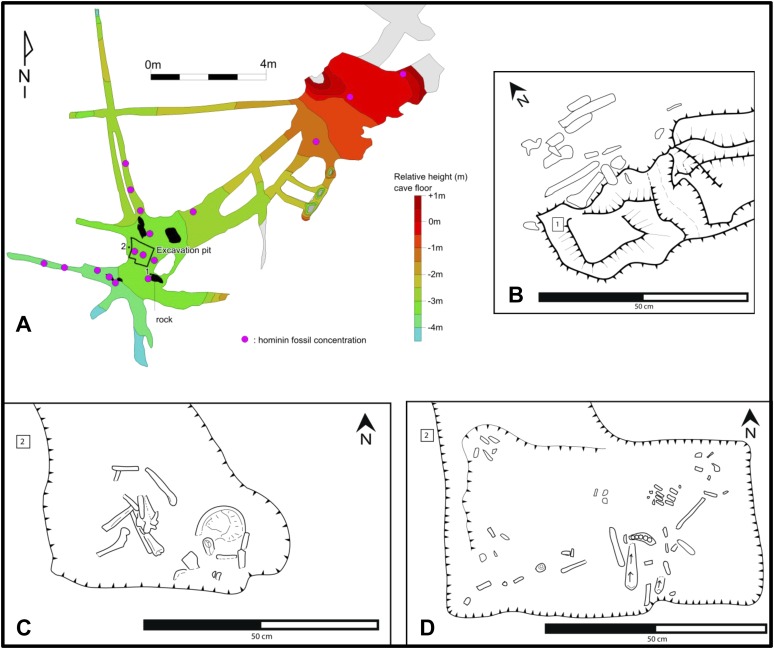
Figure 7. Map of the cave chamber showing the distribution of hominin fossils.
(A) distribution of concentrations of bone fragments of H. naledi along the floor of the Dinaledi Chamber. The positions of maps (B) and (C), (D) are shown relative to survey pegs 1 and 2 respectively. (B) Concentration of long bone fragments encountered next to a rock embedded in Unit 3 sediment. (C) Distribution of fossils in the excavation pit at the start of the excavations in November 2013 (∼5 cm below surface). (D) Distribution of fossils in the excavation pit during excavations in March 2014 (∼15 cm below surface); the long-bone in the central part of the pit is in a near-vertical position and is shown in Figure 9C.

