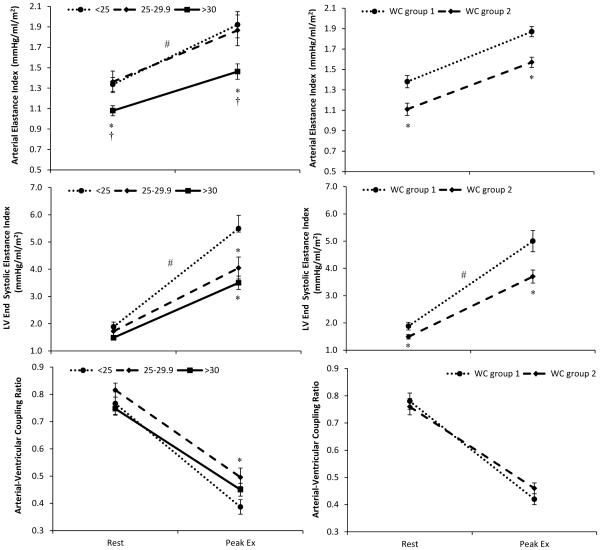
Figure 2. Arterial-ventricular coupling response to exercise.
The change from rest to peak exercise (Ex) in (A and B) effective arterial-elastance index, (C and D) left ventricular end-systolic elastance index, and (E and F) arterial-ventricular coupling ratio by body mass index (BMI: normal weight<25 kg/m2; overweight 25.0-29.9 kg/m2; and obese as BMI≥30 kg/m2) and waist circumference (WC: group 1 = non-risk male<102, female<88; group 2 = at risk-male≥ 102, female≥88) group. A group (BMI categories) by time (rest and peak Ex) interaction was found for EaI, and EesI whereby obese subjects had a blunted increase in EaI and EesI during exercise. Further, overweight subjects also had a blunted increase in EesI vs. normal weight subjects during exercise. As for the relationship between WC and arterial-ventricular coupling, a significant group (WC) by time (rest and peak Ex) interaction was found for EesI, but not for EaI or EaI/EesI. *p<0.05 compared to normal weight subjects (i.e., BMI<25 kg/m2, or WC group 1) † vs. overweight subjects; #p<0.05 time by group interaction. Data presented as means ± SEM.

