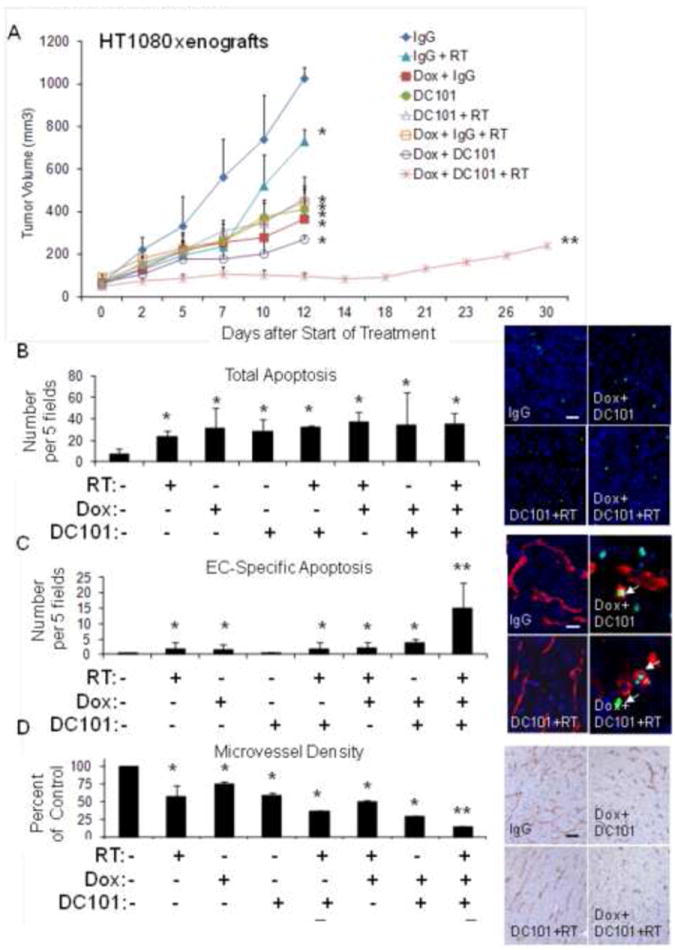
Figure 1.

(A) HT1080 xenografts. Groups were treated with control IgG, DC101, RT (8 Gy × 1), and/or metronomic doxorubicin (Dox). Graph and photos of total apoptosis (B), EC-specific apoptosis (C), and microvessel density (D) in HT1080 tumor groups. Arrows point to TUNEL and CD31 positive cells. Scale bar = 10-50 μm. Bars represent standard deviation. *p<0.05 compared to control IgG group, **p<0.05 compared to all other groups.
