
Figure 3.
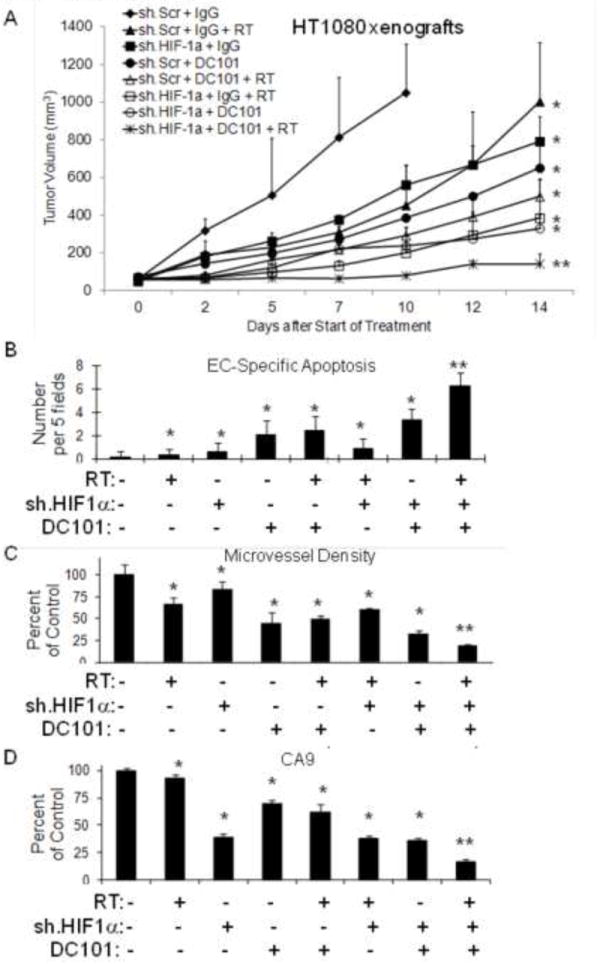
(A) HT1080 cells transduced with HIF-1α shRNA (sh.HIF-1α) or scrambled shRNA (sh.Scr) followed by subcutaneous flank injection in athymic nude mice. Groups were treated with DC101 or control IgG. Some groups received RT 8 Gy × 1. Graphs of EC-specific apoptosis (B), microvessel density (C), and CA9 expression (D) in HT1080 tumor groups. Bars represent standard deviation. *p<0.05 compared to control group, **p<0.05 compared to all other groups.