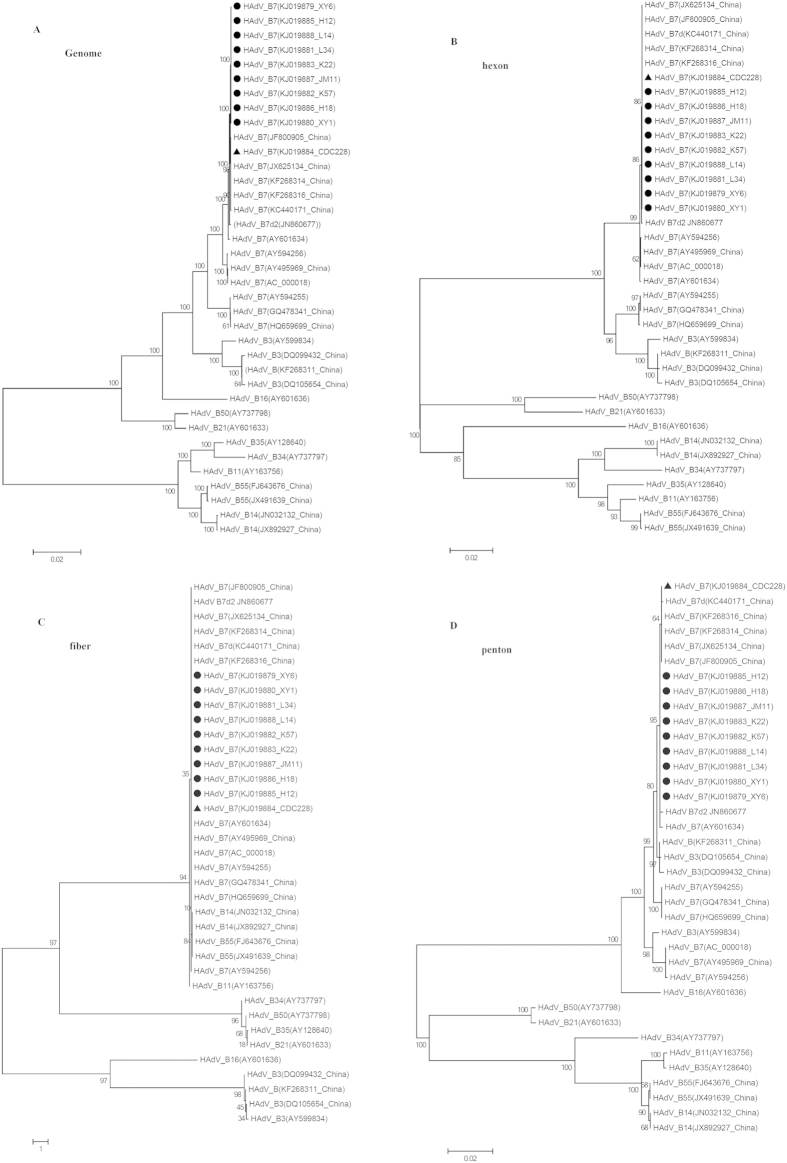
Figure 3. Phylogenetic analysis of the outbreak isolates based on WGS and individual genes.
Panels (A–D) represent the phylogenetic trees of the whole-genome, and individual entire hexon, fiber and penton genes, respectively. Outbreak strains are highlighted in circle ( ), and the local strain CDC 228 from Xiangyang City is indicated in triangle (
 ). Bootstrap analysis was performed with 1,000 replicates. Representative HAdV strains with GenBank accession numbers are included in the phylogenetic trees, and they are also shown in Table S2.

