Fig. 2.

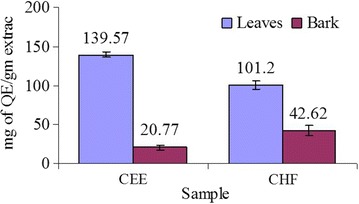
Total flavonoid content of leaves and bark. Values are represented as mg of QE/g of extract. Each value in the graph is represented as mean ± SD (n = 3)

Total flavonoid content of leaves and bark. Values are represented as mg of QE/g of extract. Each value in the graph is represented as mean ± SD (n = 3)