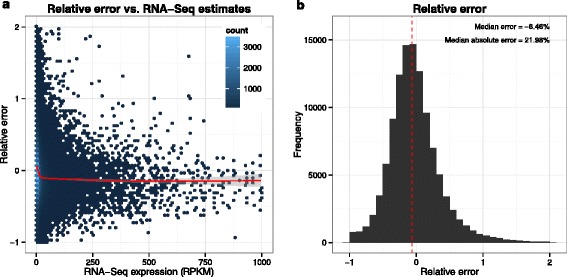
Fig. 1.

Estimation accuracy. MaLTE provides an estimate of the RNA-Seq gene expression levels from microarray probe intensities. (a) The relative error (i.e. difference between MaLTE estimate and RNA-Seq, divided by the RNA-Seq value) as a function of the RNA-Seq expression level. Each point corresponds to a bin of 75 genes. The data represents all genes but with a random subset of 10 samples for each gene. Only relative errors below 2 and RNA-Seq values between 1 and 1000 are represented. Low expression genes were excluded due to high stochasticity for low read counts. A Loess regression line is shown in red, illustrating that MaLTE slightly underestimates RNA-Seq particularly for highly-expressed genes. (b) The distribution of relative error with percentage median error and median absolute error displayed with the median error indicated by the dashed red line
