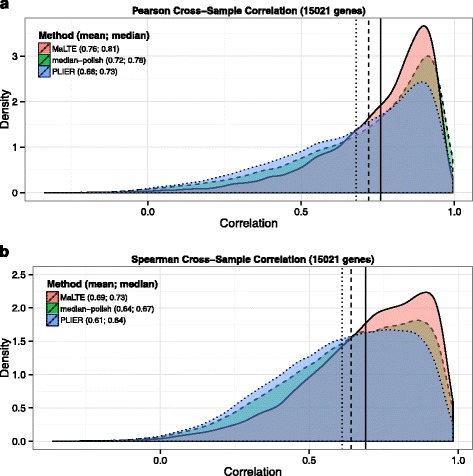
Fig. 3.

Cross-sample correlation with RNA-Seq. For each gene, the cross-sample correlation was determined between the gene expression values estimated from the microarrays using MaLTE, median-polish and PLIER. Density plots show the distribution across genes of (a) Pearson and (b) Spearman correlation coefficients. Mean and median values of the correlation coefficients are provided in parentheses next to the method name in the legend. Vertical lines show mean cross-sample correlation for MaLTE (solid), median-polish (dashed) and PLIER (dotted)
