
Figure 3.
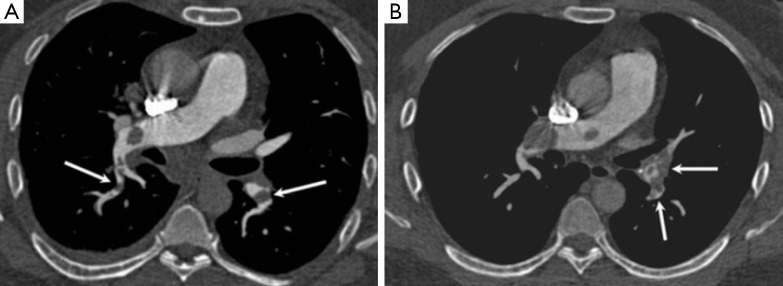
CTPA at the level of the main pulmonary artery in two patients with pulmonary embolism compares image quality at the central and peripheral pulmonary arteries in (A) the low dose 100 kV protocol and (B) in the standard dose 120 kV protocol. Note the emboli in the segmental arteries of the lower lobes (arrows). CTPA, computed tomography pulmonary angiography; kV, kilovoltage.