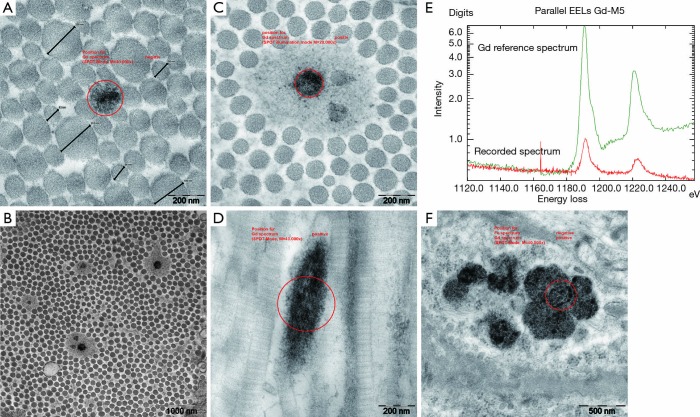
Figure 4.
Phase 1 study. EM reveals alterations of collagen fibres and lysosomal Gd deposition in the gadodiamide treated rats. (A) Collagen fibre diameter variation in a collagen bundle without abnormalities in the fibre profile. Note one fibre with Gd3+ incrustations (circle represents the area analysed by the EELS elemental analysis); (B) example of a collagen bundle with typical distribution of some collagen fibres surrounded by “halo” formation, overview; (C) detail showing the extend of the “halo” phenomenon including three collagen fibres and one with a dark Gd3+ deposition; (D) longitudinal section of a collagen fibre with dark Gd incrustation displaying a fuzzy filamentous texture; (E) corresponding recorded EELS spectrum from the area encircled in image D confirming Gd3+ content in the analyzed deposition (red = recorded sample spectrum; green = Gd reference spectrum); (F) example of multiple lysosomal Gd3+ rich inclusions with granular texture in perifollicular smooth muscle cells. Gd, gadolinium; EELS, electron energy loss spectroscopy.

