
Figure 5.
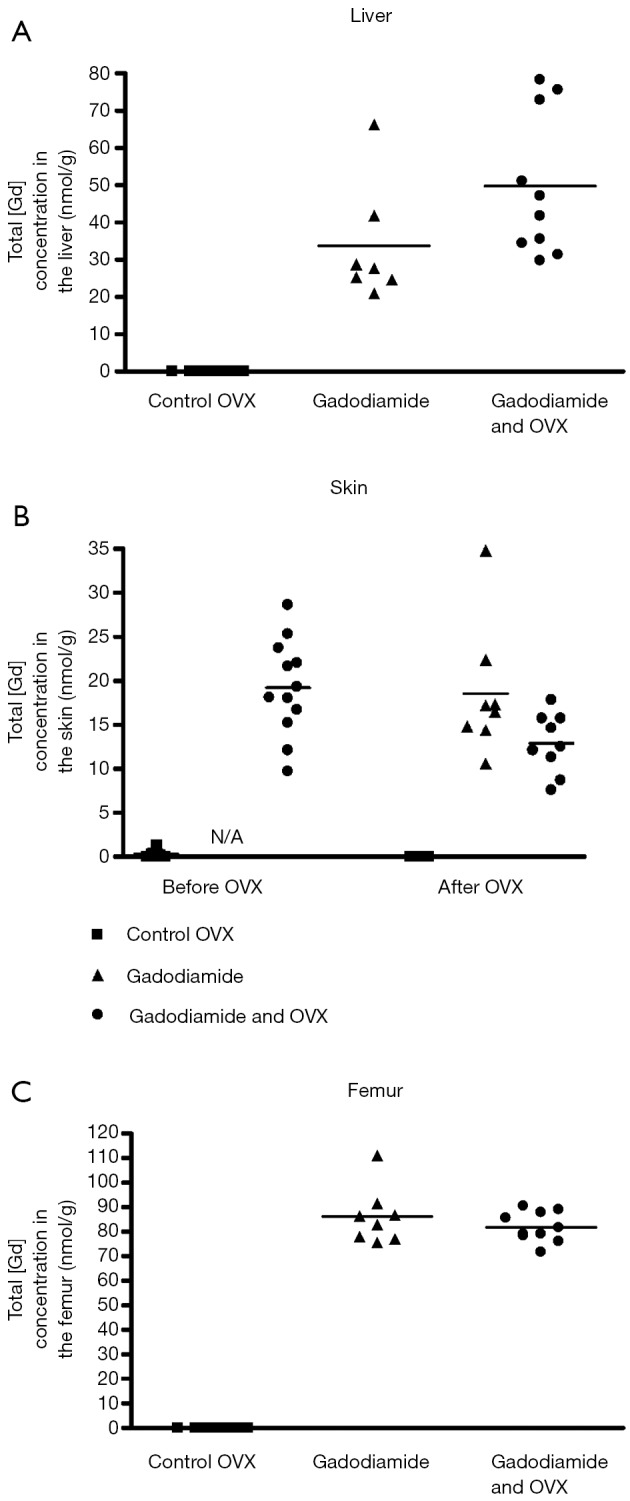
Phase 2 study. Total Gd3+ concentration (nmol/g, ICP-MS measurement) in liver (A), skin (B); and bone (C) samples of rats receiving gadodiamide with or without OVX and of control rats. OVX, ovariectomy; Gd, gadolinium.
Official websites use .gov
A
.gov website belongs to an official
government organization in the United States.
Secure .gov websites use HTTPS
A lock (
) or https:// means you've safely
connected to the .gov website. Share sensitive
information only on official, secure websites.
Phase 2 study. Total Gd3+ concentration (nmol/g, ICP-MS measurement) in liver (A), skin (B); and bone (C) samples of rats receiving gadodiamide with or without OVX and of control rats. OVX, ovariectomy; Gd, gadolinium.