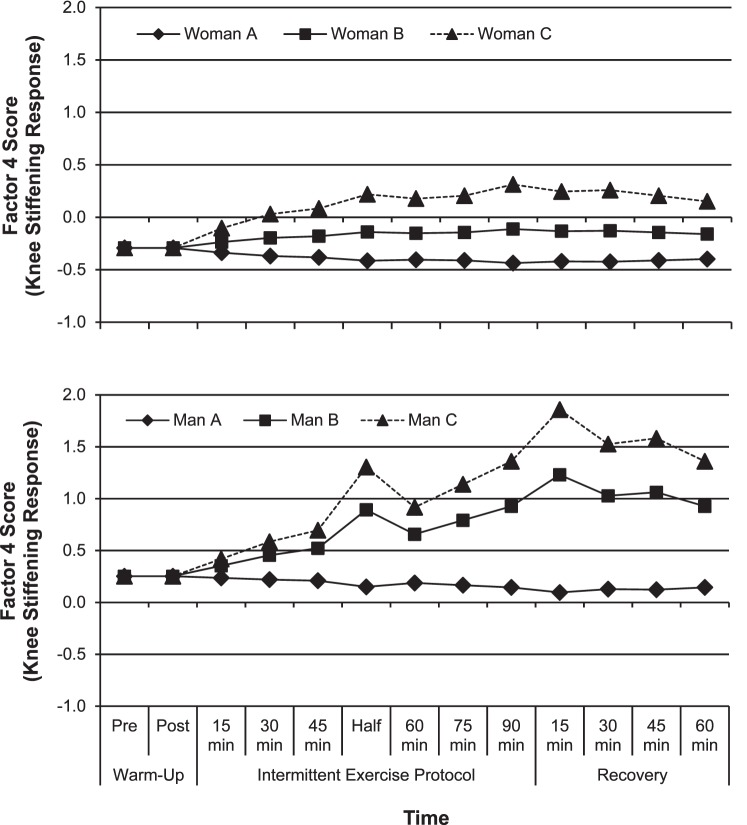
Figure 4.
Exemplar data depicting the predicted changes in the knee-stiffening response (factor 4) between women (top graph) and men (bottom graft) with, A, average baseline knee laxity, B, above-average anterior-posterior knee laxity (APLAX; +1 SD above the mean), but average varus-valgus knee laxity (VVLAX) and internal-external rotation knee laxity (IERLAX), and C, above-average APLAX but below-average VVLAX and IERLAX (−1 SD below the mean).

