FIGURE 4.
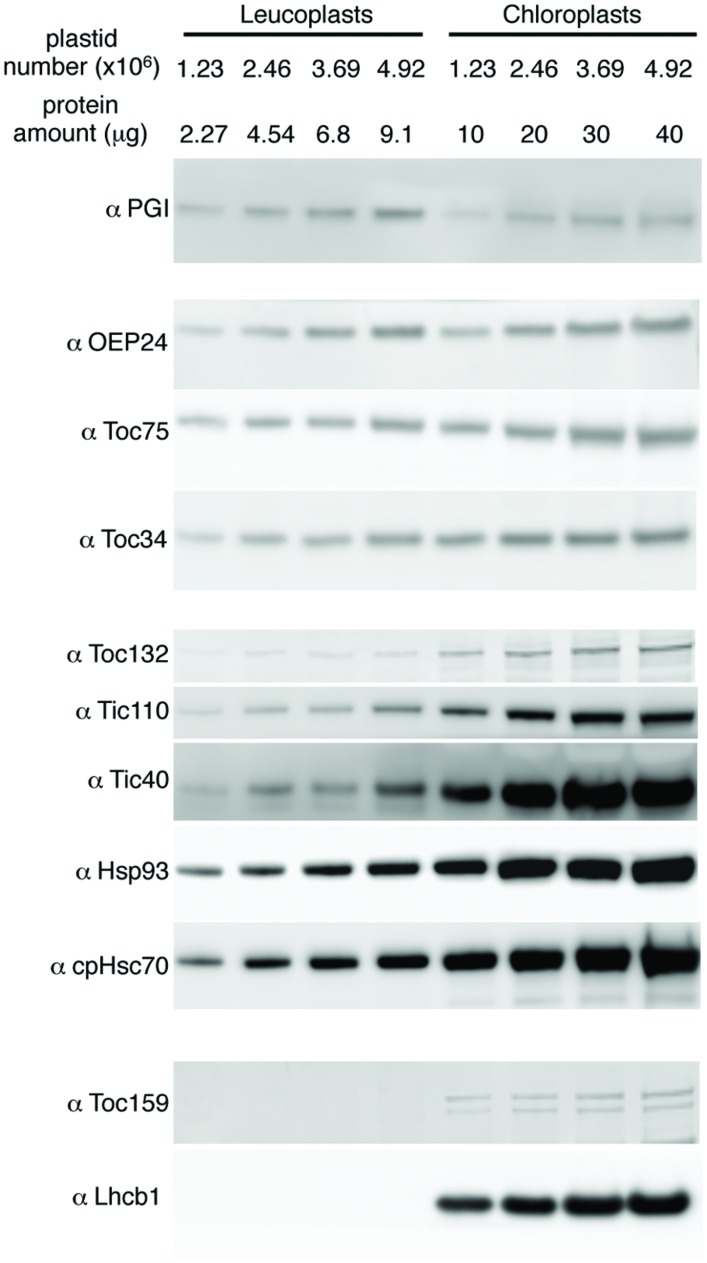
Translocon protein abundance in leucoplasts and chloroplasts compared on an equal number of plastids basis. Various amounts of isolated leucoplasts and chloroplasts were analyzed by SDS-PAGE and immunoblotting with antibodies indicated at left. The amount of protein loaded in each lane and the equivalent number of plastids are indicated above the lanes.

