
Figure 4.
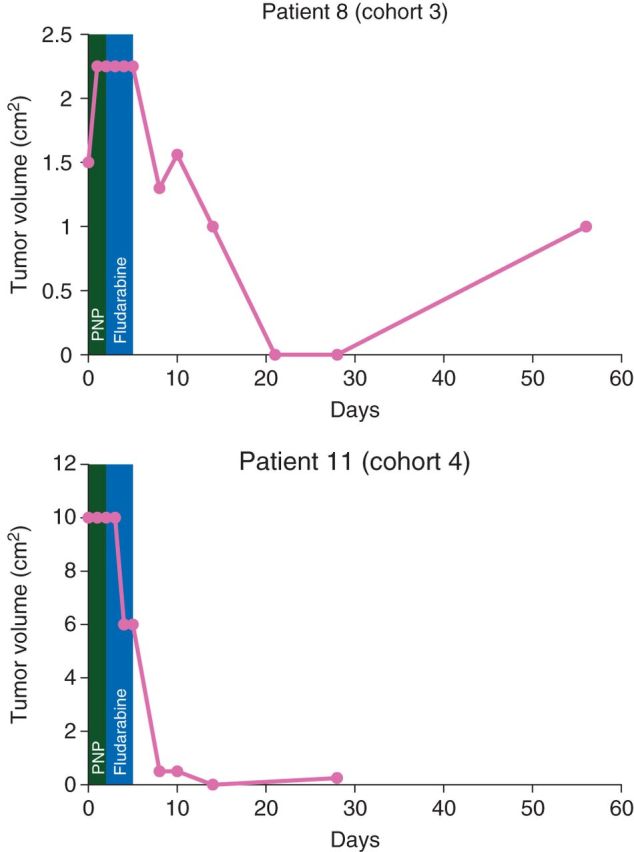
Serial tumor volume measurements for patients with complete tumor regression. Complete tumor volume measurements are plotted for two patients with complete tumor regression. A green box identifies the timeframe for the viral injection of purine nucleoside phosphorylase (PNP) and a blue box identifies the timeframe for fludarabine injection. Patient 11 was lost to follow-up for day 56.