
FIGURE 4.
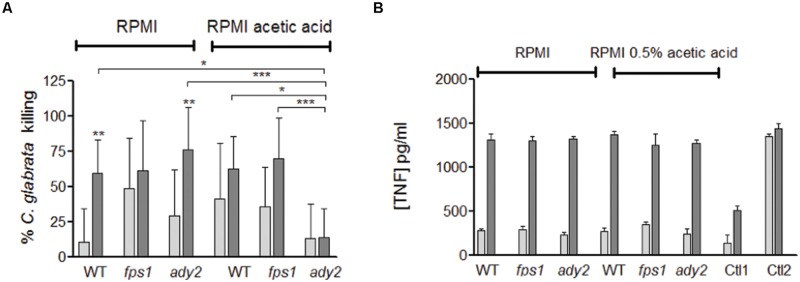
Evaluation of the interaction of C. glabrata HTL, fps1, and ady2a cells with macrophages. (A) Percentage of C. glabrata killing by macrophages evaluated by CFU and (B) the TNF-α concentration released by macrophages infected with C. glabrata strains in pg/ml, Ctl1 and Ctl2 corresponds to the macrophages control and incubated with LPS, respectively. The results were assessed at 3 and 18 h post-infection (white and grey bars, respectively). Before the phagocytosis assay yeast cells were grown in two different conditions: RPMI pH 5.0 and RPMI 0.5% acetic acid at pH 5.0. Error bars represent SD. ∗, ∗∗, and ∗∗∗ means that results are statistically significant (p < 0.05), (p < 0.01), and (p < 0.001), respectively, when comparing 3 with 18 h of incubation. Other comparisons are indicated by a bar.