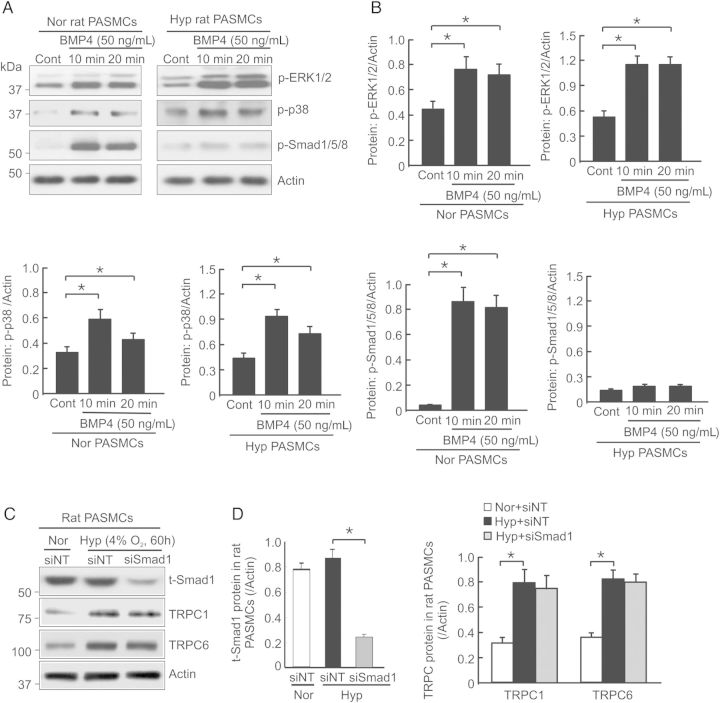
Figure 5.
Effect of Smad1 knockdown on TRPC1 and TRPC6 expression in rat PASMCs exposed to prolonged hypoxia. (A) Representative images of western blots for phosphorylated ERK1/2 (p-ERK1/2), p38 MAPK (p-p38), Smad1/5/8 (p-Smad1/5/8), and actin in rat PASMCs exposed to normoxia (Nor) or hypoxia (Hyp; 4% O2) for 60 h, and then stimulated with or without BMP4 (50 ng/mL) for 10 or 20 min (n = 4 for each group of cells). (B) Bar graphs show the intensity changes of p-ERK1/2, p-p38 and p-Smad1/5/8 normalized to actin in rat PASMCs exposed to Nor or Hyp with or without BMP4 stimulation for 10 or 20 min; values are mean ± SEM, n = 4 for each group of cells, *P < 0.05. (C) Representative western blot images of total smad1 (t-Smad1), TRPC1, TRPC6, and actin in PASMCs treated with non-targeting siRNA (siNT) + Nor, siNT + Hyp or Smad 1 targeting siRNA (siSmad1) + Hyp. (D) Bar graphs show the intensity changes in t-smad1, TRPC1 and TRPC6 normalized to actin; values are mean ± SEM, n = 4 for each group of cells, *P < 0.05.

