
Figure 7.
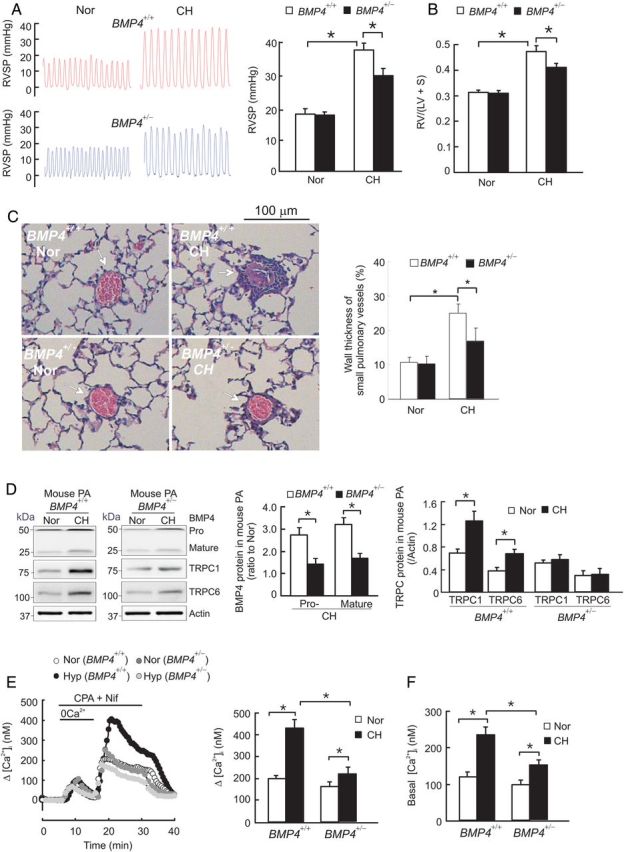
Effects of partial deficiency of BMP4 on TRPC1 and TRPC6 protein expression in distal PA, and on SOCE and basal [Ca2+]i in PASMCs from CHPH mice. (A) Representative traces of RVSP in BMP4+/+ and BMP4+/− mice exposed to normoxia (Nor) or chronic hypoxia (CH; 10% O2 for 21 days); bar graph shows the average RVSP in each group of animals (n = 6). (B) the mass ratio of right ventricle (RV) to left ventricle plus septum (LV+S), presented as RV/(LV + S) in each group of animals (n = 6). (C) Representative images of H&E staining of lung tissue showing small pulmonary vessels in BMP4+/+ and BMP4+/− mice exposed to Nor or CH; bar graph shows the wall thickness of small pulmonary vessels in each group of animals (n = 6). (D) Levels of BMP4 pro- and mature protein, TRPC1 and TRPC6 proteins in distal PA from Nor or CH exposed BMP4+/+ and BMP4+/− mice, determined by western blotting and normalized to actin (n = 5 for each group). (E) Left, traces of SOCE in PASMCs from Nor or CH exposed BMP4+/+ and BMP4+/− mice; right, bar graph shows maximum Δ[Ca2+]i in response to Ca2+ restoration; n = 5 for each group. (F) Basal [Ca2+]i in PASMCs from Nor or CH exposed BMP4+/+ and BMP4+/− mice; n = 6 for each group. Bar values are mean ± SEM, *P < 0.05.