
Figure 2.
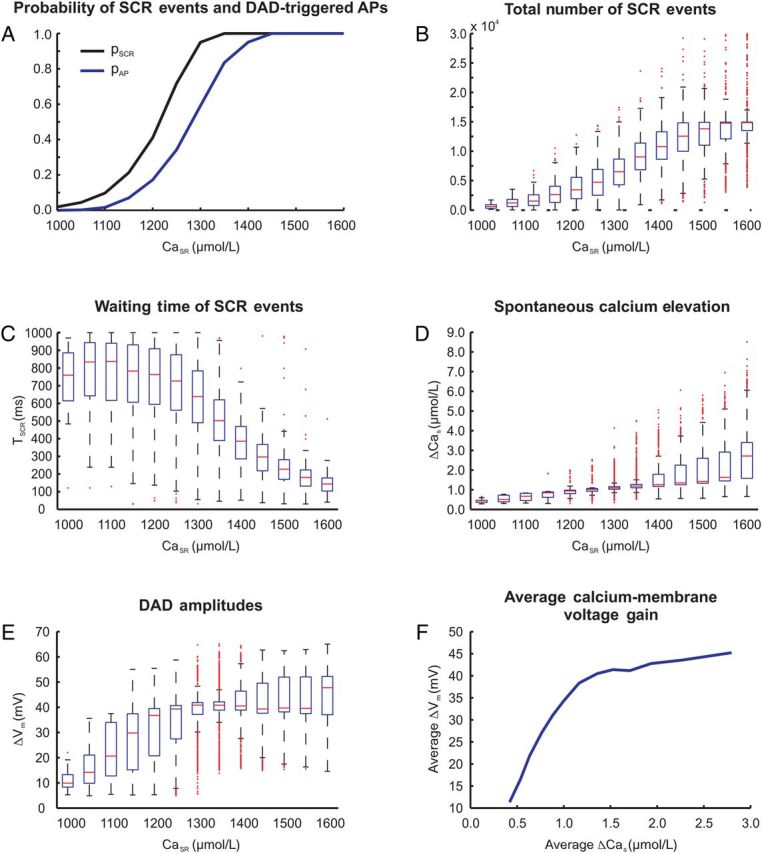
Statistics of triggered activity in N = 1110 single-cell experiments at various CaSR. (A) Probability of SCR events pSCR (black trace) and DAD-triggered APs pAP (blue trace). (B) Total number of SCR events. (C) Waiting time of SCR events, TSCR. (D) Spontaneous Ca2+ elevation ΔCas and (E) DAD amplitude ΔVm due to SCR events. (F) Average calcium-membrane voltage gain based on ΔVm and ΔCas averaged over all single-cell experiments.