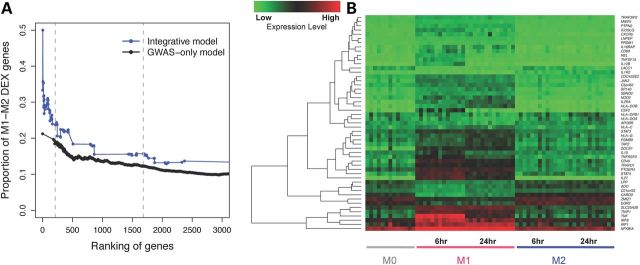
Figure 4.

Genes highly ranked in the integrative model and differential expression (DEX) between macrophage subtypes M1 and M2. (A) Proportion of genes that show differential expression between M1 and M2 macrophages, corresponding to different cutoffs on gene rankings. Genes highly ranked by the integrative model (blue curve) are more likely to be M1–M2 DEX than genes highly ranked by gene-based GWAS-only (black curve). Dashed lines indicate the top 213 genes (corresponding to gene-based genome-wide significant association, P = 3E−6), and the top 1685 genes in the integrative model. (B) Heatmap showing expression levels of 51 genes both highly prioritized by our integrative model (top 213 genes) and differentially expressed between polarized macrophage subtypes M1 and M2 at either time point 6 or 24 h after treatment with IFN-γ or IL4. M0 denotes macrophages that have not yet been polarized to be M1-like or M2-like. Red colors correspond to higher expression level and green corresponds to lower expression level. Genes are hierarchically clustered according to their expression pattern.
